Read our blogs, tips and tutorials
Try our exercises or test your skills
Watch our tutorial videos or shorts
Take a self-paced course
Read our recent newsletters
License our courseware
Book expert consultancy
Buy our publications
Get help in using our site
552 attributed reviews in the last 3 years
Refreshingly small course sizes
Outstandingly good courseware
Whizzy online classrooms
Wise Owl trainers only (no freelancers)
Almost no cancellations
We have genuine integrity
We invoice after training
Review 30+ years of Wise Owl
View our top 100 clients
Search our website
We also send out useful tips in a monthly email newsletter ...
Creating reports in Power BI with dynamic measures or dynamic dimensions Part three of a three-part series of blogs |
---|
This blog shows how to create fully dynamic reports, whereby users can choose which statistics to show and which dimensions to report them by.
|
In this blog
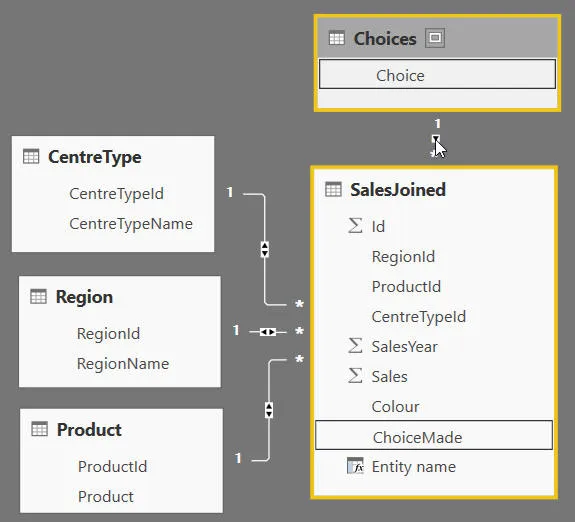
To get this to work, we'll have to create two new tables:
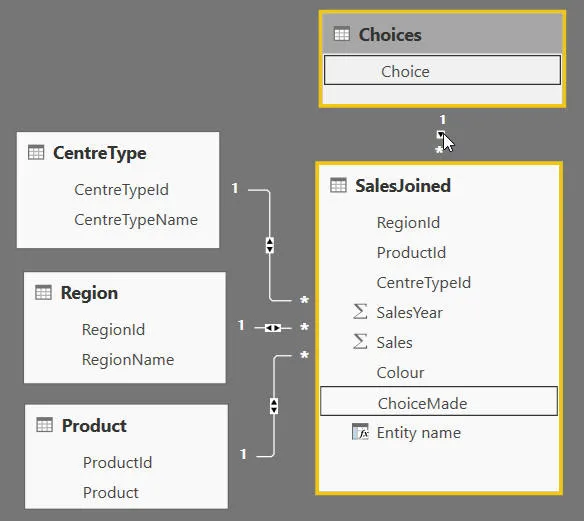
The Choices table will contain the dimensions you can report by, and the SalesJoined table will combine all of the centre types, all of the regions and all of the products. To see how this all works, read on!
The first thing to do is to create a table giving a user a choice of which dimension to report by:
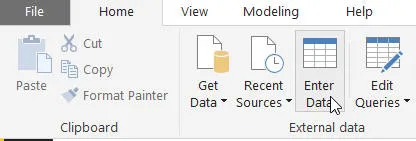
Click on the Enter Data tool to create a new table.
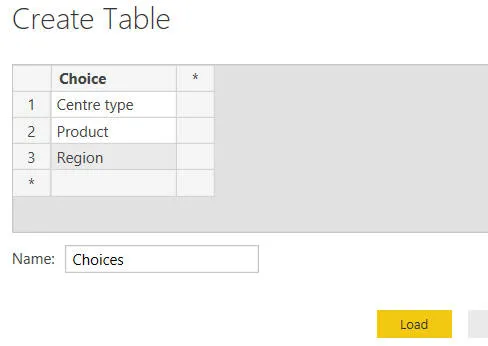
Type in one value for each dimension a user could choose to report by:
Here a user can choose to summarise sales by centre type, product or region.
Having created a table of choices, you can now create a slicer allowing a user to choose one of them:
As for the previous example, the only way to prevent a user choosing more than one dimension at a time would be to use a Chiclet Slicer custom visual.
To give your visual a nice title, create a separate card:
Although this looks like a title for the visual, it's actually a separate visual with the same width.
Create a measure using the following formula:
Title = IF(
HASONEVALUE(Choices[Choice]),
"Sales by " & SELECTEDVALUE(Choices[Choice]),
"Choose one value in the slicer"
)
If you display this measure on your card, it should show Sales by Centre type, Sales by Product or Sales by Region.
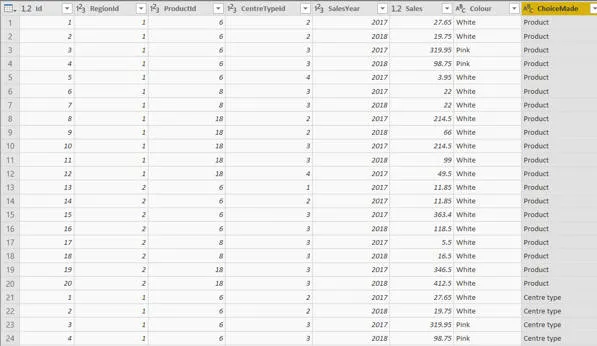
Our eventual aim is to create a table which lists all the products, centre types and regions in a single table:
The start of the combined table (the ChoiceMade column will give the words Product, Centre type or Region).
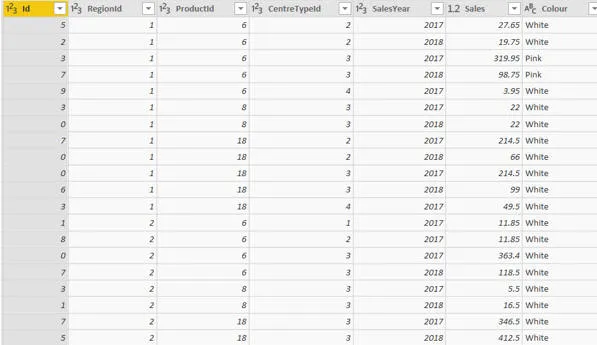
To do this, first go into Query Editor. You should have a single copy of the SalesData table:
This table shows which region, product and centre type each sale belongs to.
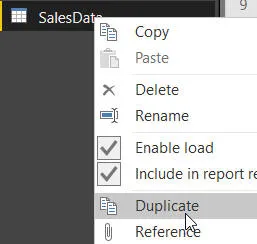
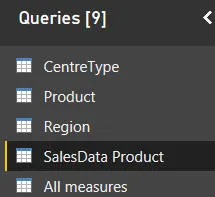
Right-click on this table and create 3 duplicates:
Call your duplicate tables SalesData Region, SalesData Product and SalesData CentreType.
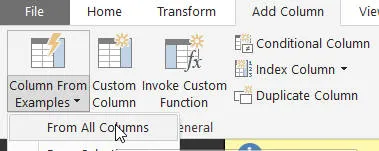
Here's how to transform the SalesData Product table (you'd do analogous steps for the other two dimension tables). First add a new column saying what sort of a thing each row is:
Choose this option on the Add Column tab.
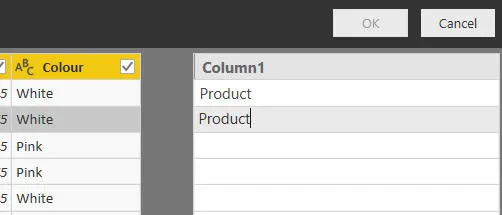
Type in Product twice:
By the time you've done this twice, you'll be able to choose OK to create the new column.
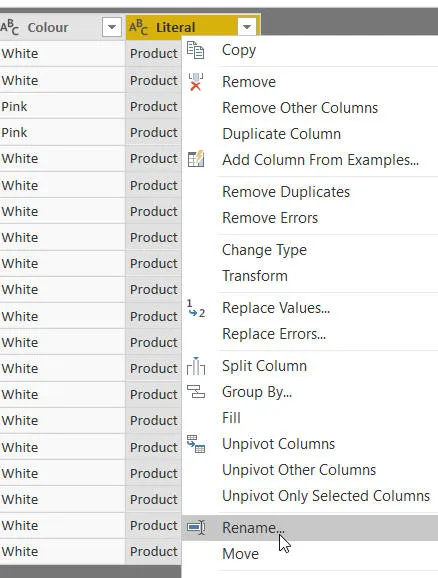
Rename this new column from Literal to Dimension:
Change the column name to something more meaningful.
Repeat the above process for the SalesData Region and SalesData CentreType tables.
You now need to create a single table containing all of the products, regions and centre types.
For those who know SQL, what you're doing is creating a UNION ALL query to combine the rows from the 3 dimension tables.
To do this, select one of the tables:
It doesn't matter which of the 3 tables you choose first.
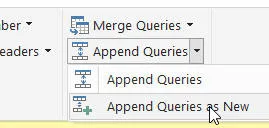
On the Home tab of the Query Editor ribbon, choose to append data:
Choose to create a new query, appending data from existing tables.
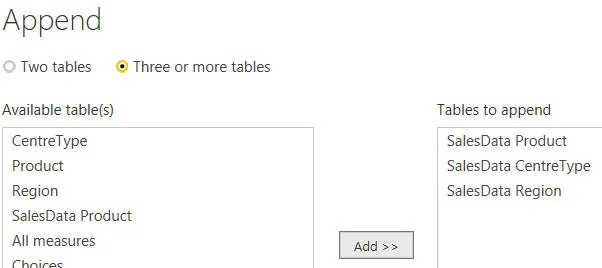
Choose Three or more tables, and select the tables whose data you want to append:
Here we're appending product sales data, centre type sales data and regional sales data.
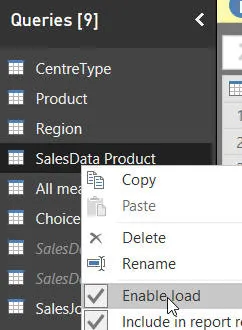
You can now tell Power BI not to bother loading data for the 3 source queries:
There's no point in loading separate copies of the sales data.
Back in Power BI proper, you should now create the relationship shown:
The relationship between the Choices table and the sales data ensures that when a user chooses a dimension in the slicer, only sales data for this dimension appears in the visual.
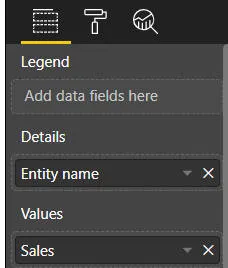
You can't make the aggregating field in a visual dynamic:
The Details field has to have the same name, regardless of whether a user chose to show sales by product, region or centre type.
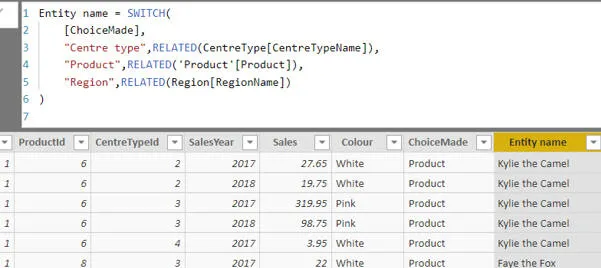
To get this to work, create this new column in the SalesJoined table:
The formula for the new column will display the centre type, product or region according to the choice a user makes in the slicer.
Finally you can now create the visual:
The visual sums sales data by the selected entity name.
It's been a long journey, but you have now arrived!
Parts of this blog |
---|
|
Some other pages relevant to the above blogs include:
Kingsmoor House
Railway Street
GLOSSOP
SK13 2AA
Landmark Offices
99 Bishopsgate
LONDON
EC2M 3XD
Holiday Inn
25 Aytoun Street
MANCHESTER
M1 3AE
© Wise Owl Business Solutions Ltd 2025. All Rights Reserved.