Read our blogs, tips and tutorials
Try our exercises or test your skills
Watch our tutorial videos or shorts
Take a self-paced course
Read our recent newsletters
License our courseware
Book expert consultancy
Buy our publications
Get help in using our site
551 attributed reviews in the last 3 years
Refreshingly small course sizes
Outstandingly good courseware
Whizzy online classrooms
Wise Owl trainers only (no freelancers)
Almost no cancellations
We have genuine integrity
We invoice after training
Review 30+ years of Wise Owl
View our top 100 clients
Search our website
We also send out useful tips in a monthly email newsletter ...
Excel MasterClass: creating a worksheet and chart to track your weight |
---|
It's fairly easy to create a simple Excel worksheet to chart your weight, but this master class shows you lots of tips and tricks to make the final result quicker to create and easier to use. |
In this blog
So you're worried about your weight, and want to track it in Excel? This master class (the first in what I hope will become a series) shows how to create a chart which will automatically update when you type in new measurement.
This master class assumes that you already know how to use Excel - it's designed to show quick and innovative ways to do things, not to teach the basics.
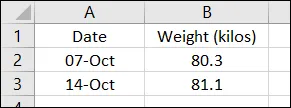
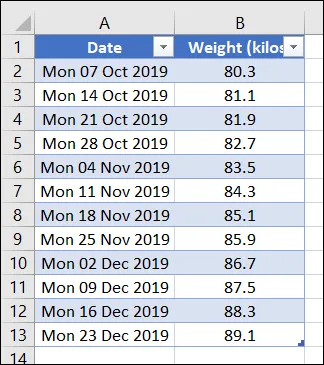
Create a new worksheet and type in some basic data:
It's a good idea to weigh yourself once a week (here it's every Monday, although that will only become clear when we change the date format).
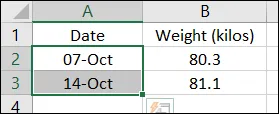
Select the date cells, and format them:
Select these cells, and press CTRL + 1 to bring up the Format Cells dialog box.
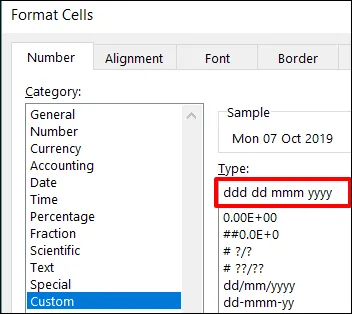
Type in a custom number formatting code:
The more of each letter you type in, the more information the date will display. Try it!
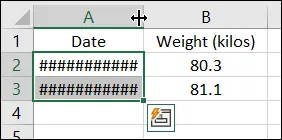
Double-click on the column, which now isn't wide enough:
Double-click where shown to widen column A.
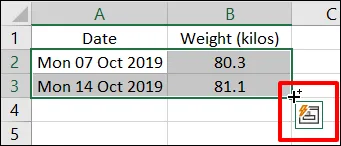
To give yourself some sample data, select the cells and use the mouse pointer shown to click and drag down:
Position the mouse pointer exactly as shown, and click and drag down to extend the range.
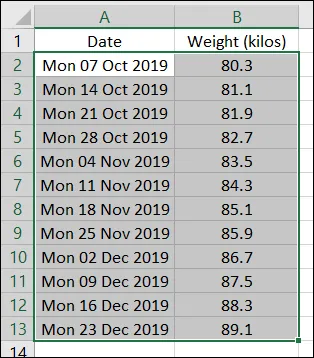
The nice thing about this is that the date formatting is copied, and you get one weight per week:
Excel adds a 7-day interval for each new date, extrapolating the interval between the first two dates.
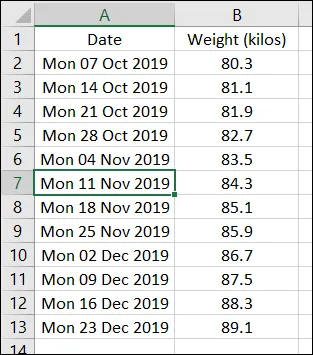
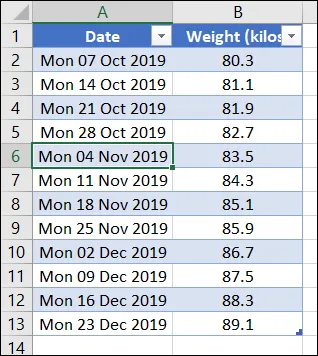
The easiest way to make your chart extend automatically when you add a new row to your data is to turn the data into a table. First select any single cell:
Which cell? That's up to you, but make sure it is just one cell. When you create a table (as shown below) Excel will then push up, down, left and right until it hits either blank rows or columns or the edge of the worksheet.
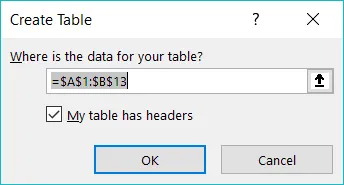
Press Ctrl + T to create a table:
Excel will show this dialog box. Your block of data will be selected automatically - all that you need to do is to select OK.
Excel applies formatting to the table:
When you add rows to the table, the internal range name will be automatically extended downwards to accommodate them.
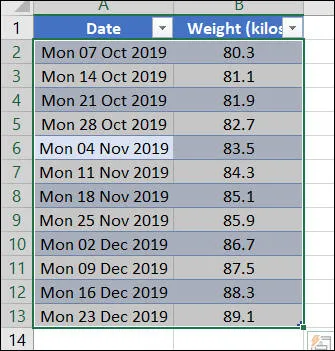
There are obviously many ways to create a chart, but here's one of the easiest. First select the data:
Click on any single cell, then press Ctrl + A to select the block.
Now press Alt + F1 to create a chart on the same worksheet:
Excel will chart the data shown selected.
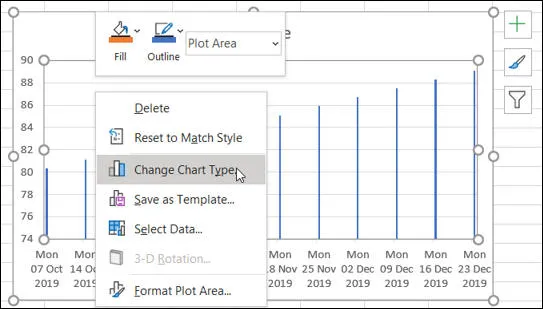
Excel will create your default chart type, which you can then change:
Right-click on the background of the chart and choose the option shown to change its type.
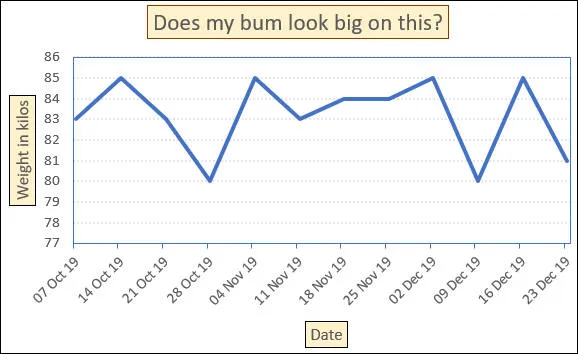
You could if you like spend some time formatting your chart:
I haven't included how to format the chart, but it's easy enough to work most things out I hope.
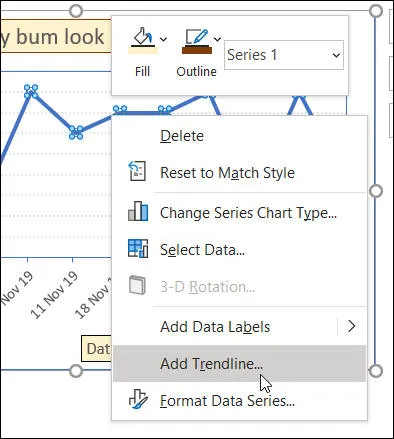
You may have put on a pound (or kilogram) or two this month, but this might be just seasonal variation (it's Christmas, and you ALWAYS eat a whole tin of Quality Street at Christmas). To iron out this variation, add a trend line:
Right-click on your line chart, and choose to add a trend line to it.
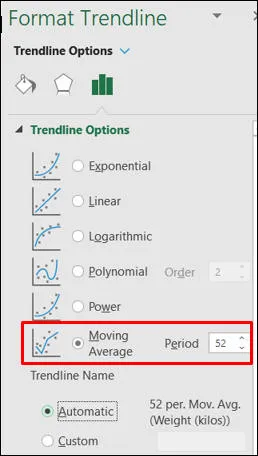
Set this trend line to be a 52 week moving average (although you won't be able to do this until you've accumulated at least 53 weeks of data):
Choose to create a moving average, and set the period to 52 weeks.
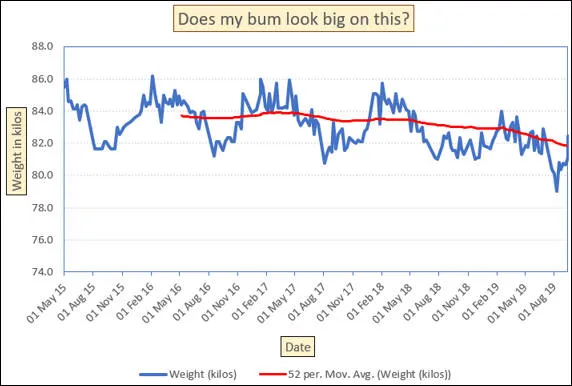
You should now have a chart which automatically expands when you add another row to your table of weights!
This (non-imaginary) trainer has a clear seasonal pattern: he stuffs himself at Christmas and takes family holidays involving exercise in the summer. The red moving average line smooths out these seasonal variations, and shows an unmistakable - and very welcome - slight downward trend.
Some other pages relevant to the above blog include:
Kingsmoor House
Railway Street
GLOSSOP
SK13 2AA
Landmark Offices
99 Bishopsgate
LONDON
EC2M 3XD
Holiday Inn
25 Aytoun Street
MANCHESTER
M1 3AE
© Wise Owl Business Solutions Ltd 2024. All Rights Reserved.