Power Query Online now supports flow diagrams!
Every now and again Microsoft introduce a software update which makes you
think: yes, that's the future. This is one such update.
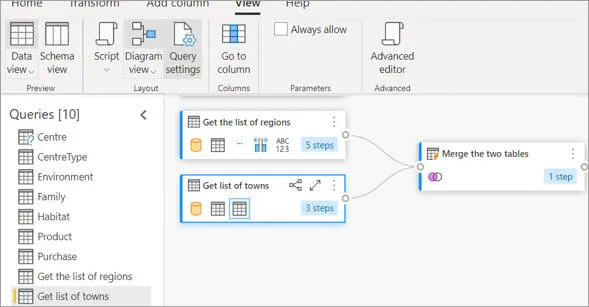
You can now see a visual representation of the steps in Query Editor (at
least, you can in the online version).
With the ability to see data flows visually, Power Query is moving from a toy
to being a full-blown ETL package!
What is Power Query Online, as opposed to Power Query?
If you're used to loading data into Excel or Power BI Desktop, you've
probably learnt a bit about Power Query:
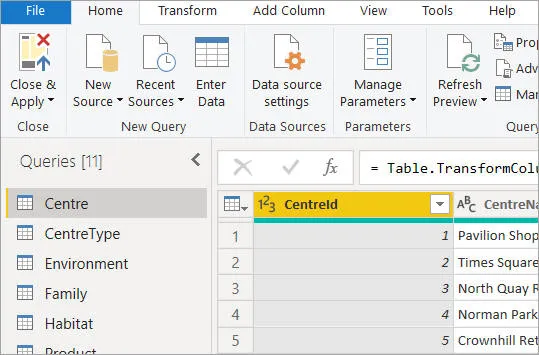
Power Query allows you to transform data before you load it (it's sometimes called an ETL package, standing for Extract, Transform and Load).
So what's Power Query Online? Starty by logging on to the Power BI Service in your browser,
so that you can see
workspaces that you've created:
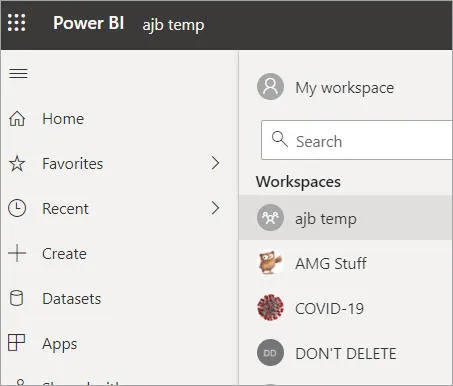
Some of the workspaces in our temporary account.
Within each workspace, you can then see reports that you've published:
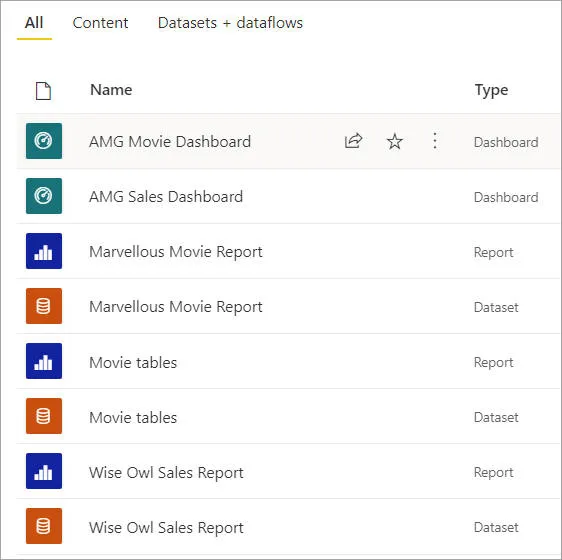
You can also see dashboards that you've created online, as well as the datasets your reports are based on.
You can also create dataflows online, which is analogous to using Query Editor
to load data in Power BI desktop:
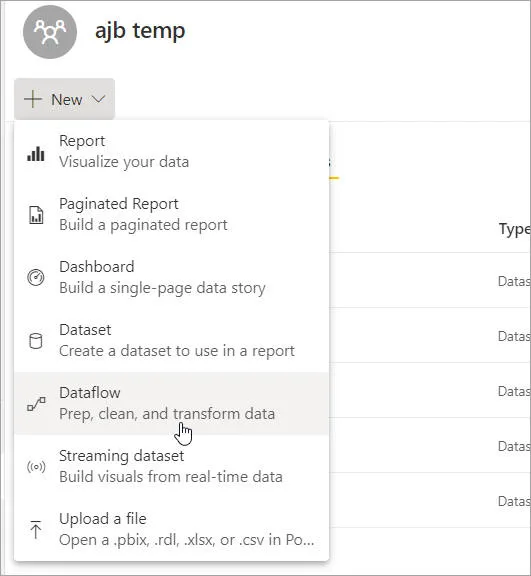
Here I'm about to add a dataflow to my temporary workspace.
You can create a dataflow based upon original data or an existing dataflow that
you've created:
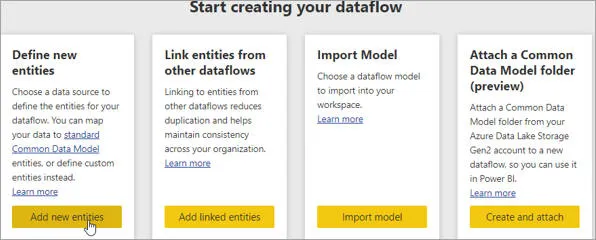
Here I'm going to base the dataflow on a SQL Server database, using a gateway Sam has set up.
I've missed out the next two steps (this isn't meant to be a tutorial), but
if you have a gateway set up you can use it to load data in the usual way.
If you haven't got a gateway set up, you'll need to find another way to link
to your data online.
You're now in Power Query Online!
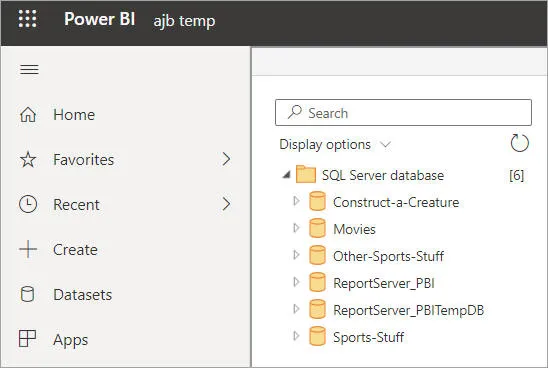
You can now choose which tables you want to load.
Diagram view
So initially things look just like vanilla Query Editor, until you switch to
diagram view:
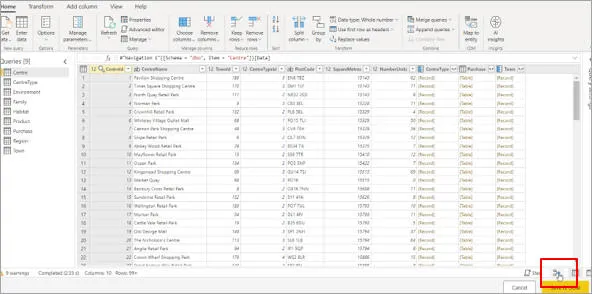
One way to do this is to click on the icon shown above.
Each query now shows as a separate flow:
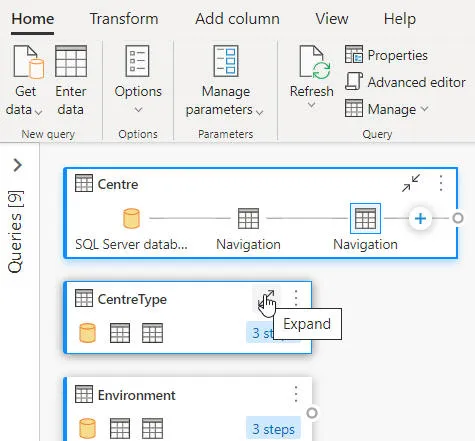
You can click on the icon shown above to expand or collapse any query's steps.
I quite like the newly-added Compact view, which shows steps in
a column rather than a line:
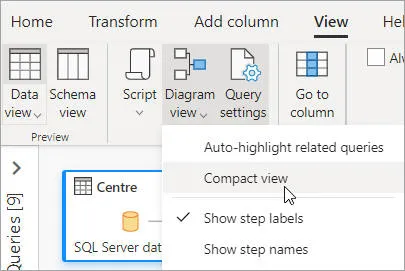
How to turn compact view on and off.
Whether you prefer this is up to you:
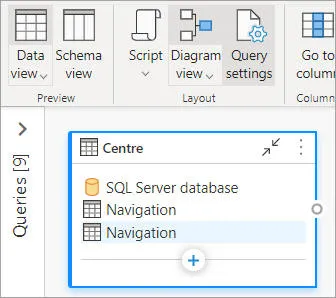
The tables take up more vertical room but less horizontal space.
There's also a nice option to expand or collapse all of your queries:
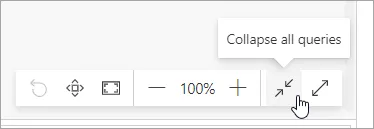
You can expand or collapse all your queries by clicking on this tool (the toolbar also allows you to zoom in and out, or
to make everything fit on your screen).
Working with steps
The easiest way to add a step to the end of a query is now to click on the +
symbol:
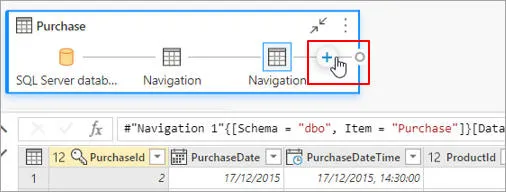
Click on this icon to add an additional step to (in this case) the
Purchase table.
Because I've got a column
selected, I'll see the option to remove a column:
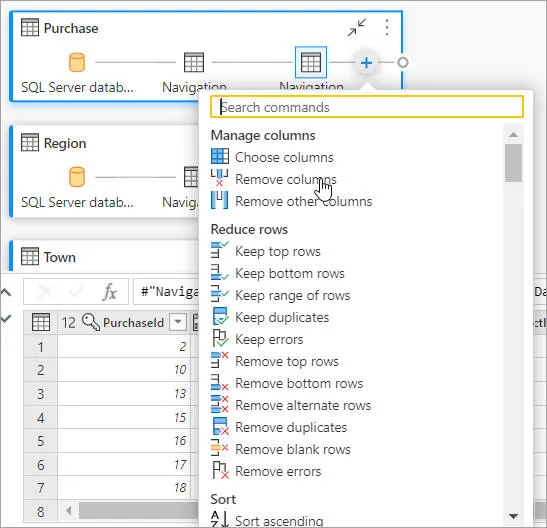
You can see
the relevant options given your current selection.
You now get a cute little extra icon:

My extra step.
I can even rename this in situ if I switch to showing the names of my
steps, not their standard labels:
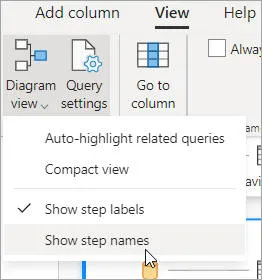
You can choose either to show step labels (the default) or the names you've given to each step.
I can then double-click on any name to change it to anything I like:

Here I'm in the middle of changing this step's name.
Working with multiple queries
Where the new visual diagrams really come into their own is when you want to
combine queries. You can use the Ctrl key
to select more than one query at a time:
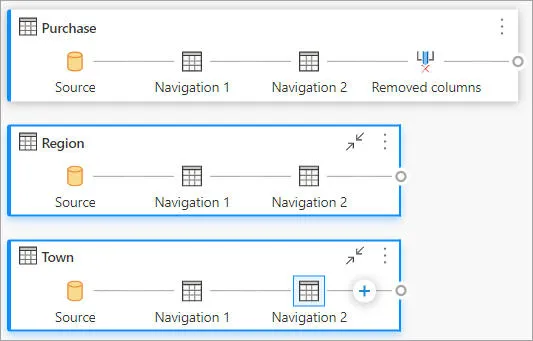
Here I've got the
Region and Town tables selected (I'm going to merge them).
If you right-click, you see a menu of things you can do when you have more tha
one query selected:
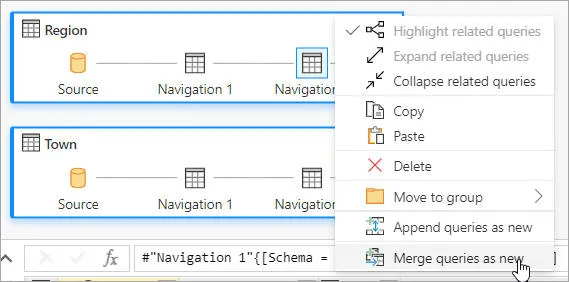
I'm going to merge the two queries to make one new one, using the option shown selected.
I was going to miss out the details of this, until I saw the funky join diagrams
at the bottom of the dialog box which appears:
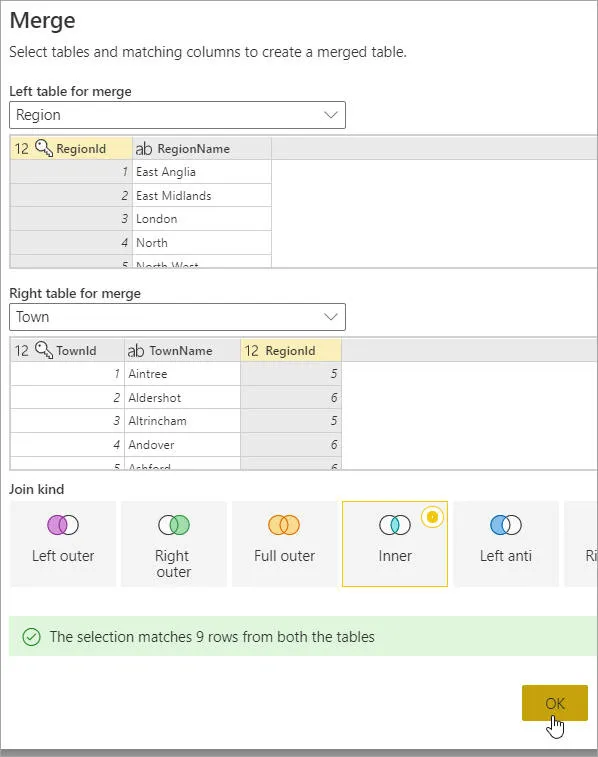
Why can't the desktop version of Query Editor have these nice diagrams!!
The diagram now shows me how data is flowing!

You can see that the query on the right depends on the two to the left.
Just in case you were in any doubt, you could choose to highlight related
queries for the one on the right (say):
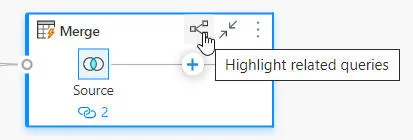
You can click on this icon to show all of the queries which are linked to this one.
Here's what this shows in this instance:
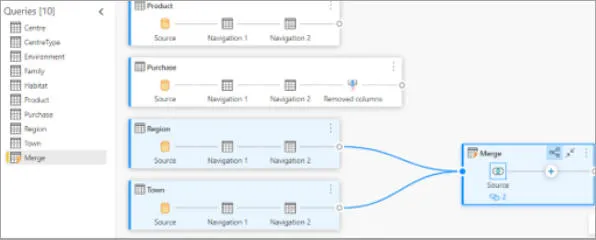
I imagine this
feature would be most useful for more complicated flow diagrams!
Limitations of Power Query Online
This should really be "Limitation", as there's one glaring omission from the
first released version of the software:
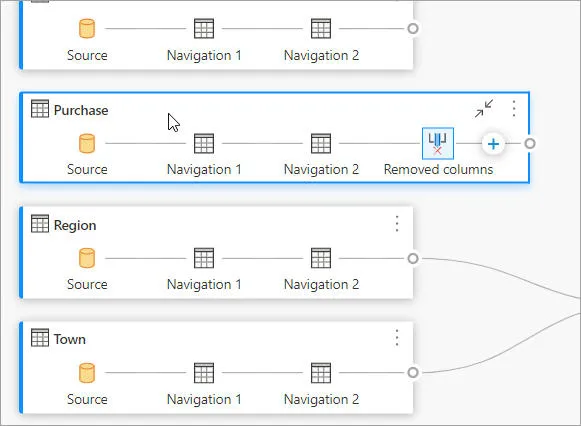
Want to move the
Purchase table a bit to the right? You can't!
I'm sure Microsoft are feverishly working on this feature. Those who
have used similar packages like Integration Services or Alteryx will know how
useful it is to be able to move boxes round the screen and have the connecting
lines follow!
Find out more
You can see more details on the new Power Query Online diagram view at these
two Microsoft sites:
We suspect that in a few months (once the vanilla Query Editor is given these
new features) you'll also be able to book onto a two-day Wise Owl Query Editor
course!


