Read our blogs, tips and tutorials
Try our exercises or test your skills
Watch our tutorial videos or shorts
Take a self-paced course
Read our recent newsletters
License our courseware
Book expert consultancy
Buy our publications
Get help in using our site
547 attributed reviews in the last 3 years
Refreshingly small course sizes
Outstandingly good courseware
Whizzy online classrooms
Wise Owl trainers only (no freelancers)
Almost no cancellations
We have genuine integrity
We invoice after training
Review 30+ years of Wise Owl
View our top 100 clients
Search our website
We also send out useful tips in a monthly email newsletter ...
Changes introduced in the March 2023 Power BI Update Part four of a five-part series of blogs |
---|
This month's update is impressive - including visual subtitles, a button action to clear and apply slicers and a new PowerPoint story-telling feature - but it's the on-object interaction in preview which will truly change your life.
We've been creating our idiosyncratic monthly blogs on Power BI updates since November 2016, and also deliver online and classroom Power BI courses. |
In this blog
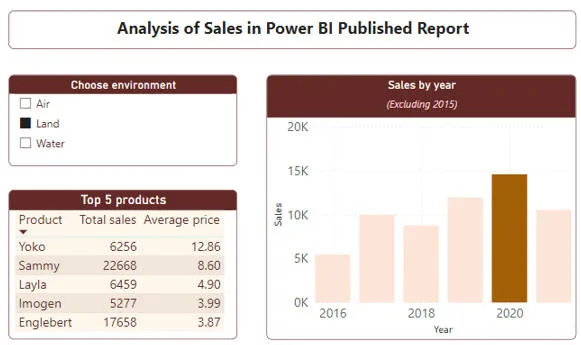
This feature has been in preview for a while, but is now on general release (meaning that any Office 365 user will have access to it). The feature allows you to take selected visuals from a published Power BI report:
A typical (ish) Power BI report ...
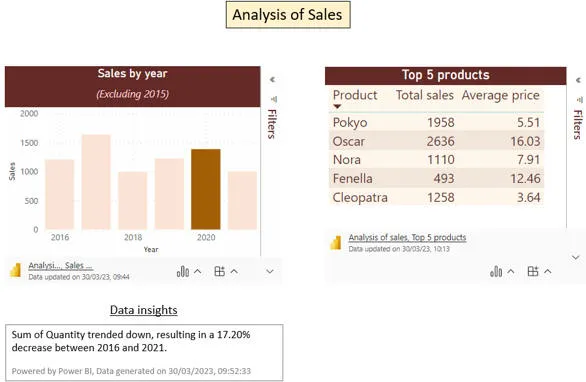
And paste these into a PowerPoint presentation:
There wouldn't be much point pasting in the slicer, since this has no effect when pasted into a PowerPoint presentation. I've also used the PowerPoint data insights feature to add some AI thoughts on what the data is telling me.
The amazing thing about this is that if you reload the visual (or close and re-open the presentation) any updates you've made to the visual in Power BI Desktop which you've then published automatically show up in PowerPoint!
The rest of this blog shows how to use this cool new feature!
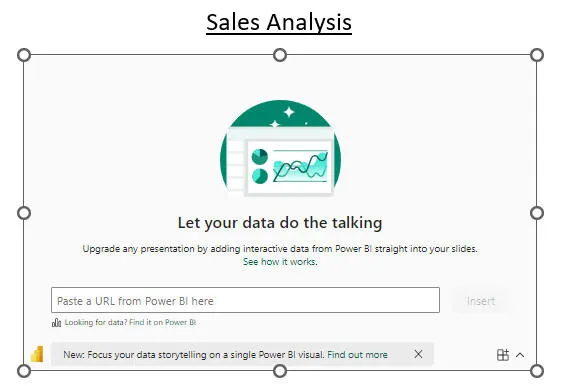
Start by adding a Power BI visual in a PowerPoint presentation:
This icon is on the PowerPoint Insert ribbon.
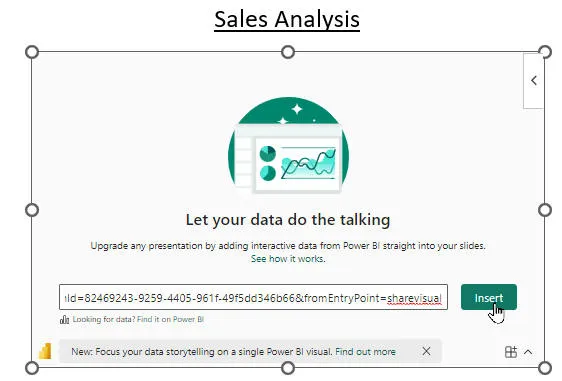
You now get a space to paste in a URL:
As to what URL to paste - read on!
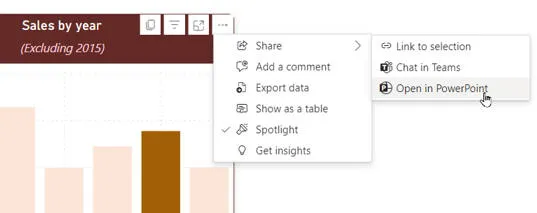
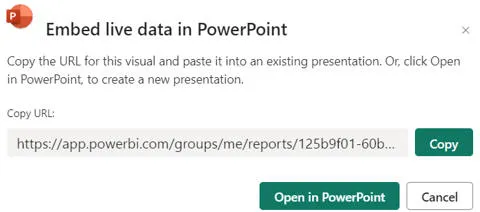
Now go to Power BI Service (so make sure you've published your report), and choose to copy the URL for a visual:
This is the (misleadingly-named) option to copy a visual's URL into a PowerPoint presentation.
When you choose this, you can then just click on the Copy button:
Once this dialog box appears, it's obvious what to do.
Back in PowerPoint you can then paste this URL into the box you created earlier, and click on Insert:
Paste the URL to the visual into the box and choose to insert it.
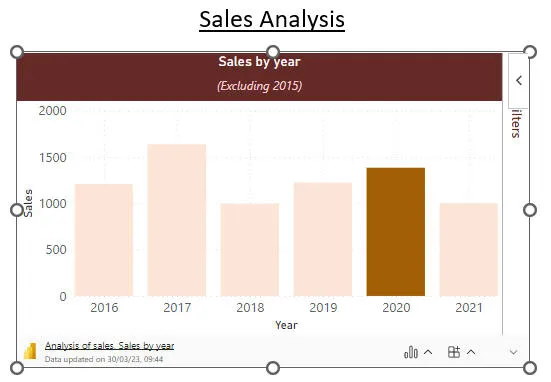
The visual will now appear on your PowerPoint slide:
You can now play about with this visual within PowerPoint (if you find out how to put a border round it, let me know!).
This idea of sharing a component between different Microsoft applications is one you may need to get used to, as it's at the heart of the new Microsoft Loop application.
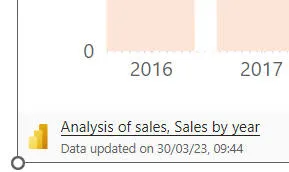
You can click on the link at the bottom left of your pasted visual to go to the report:
You could even create a PowerPoint presentation acting as a dashboard, with each included visual giving access to different reports.
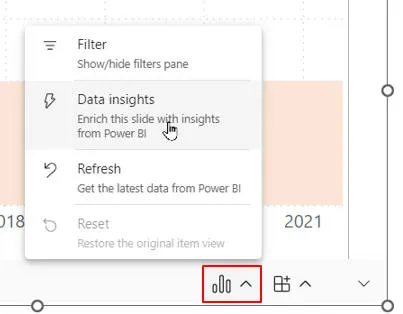
If you want to add insights to the story your visual is telling you, you can choose to add data insights:
Click on the button shown at the bottom right of your visual to add data insights.
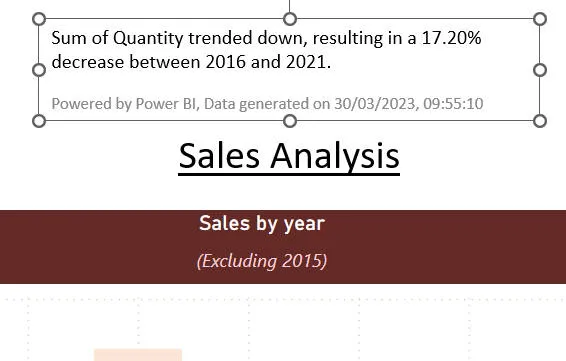
You could then paste these onto your current slide:
Choose this option to create a text box on your current slide.
The results are just free-format text, which you can alter:
I must admit I'm not a big fan of the AI generated data insights in Power BI, as I always think they are fairly obvious!
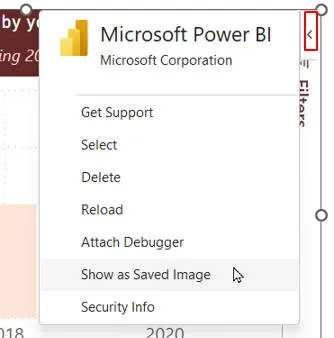
You can click on this icon at the top right of a pasted Power BI visual to freeze it:
Click on the arrow shown at the top right of a visual, and choose this option to save it as a static image.
On the plus side, this is beautifully coded (the visual is silently swapped for an image; your screen doesn't even flash). On the downside, you can't undo this, as I've just discovered!
You've been able to save a Power BI report as a PowerPoint presentation for some time now, but the above is (IMHO) a much better way to create presentations based upon Power BI reports, since you can choose which visuals to show - and where - and they update automatically when your report changes.
Parts of this blog |
---|
|
Some other pages relevant to the above blogs include:
Kingsmoor House
Railway Street
GLOSSOP
SK13 2AA
Landmark Offices
99 Bishopsgate
LONDON
EC2M 3XD
Holiday Inn
25 Aytoun Street
MANCHESTER
M1 3AE
© Wise Owl Business Solutions Ltd 2024. All Rights Reserved.