If you've spent time writing DAX measures in Power BI, you've probably invested a lot of time learning about data models, relationships, filter context and the many other things you need to understand to get the correct answer from your code. The February 2024 update to Power BI introduces visual calculations, which allows you to add DAX calculations directly to a visual in a report. This can simplify the DAX you need to write as you can refer to the values in the visual using a range of new functions. Is this a potential game-changer for DAX? Let's find out!
Enabling Visual Calculations
Currently, visual calculations are in preview so, if you want to use them, you'll need to enable the feature. To do this in Power BI Desktop, from the ribbon choose File | Options and settings | Options to display the Options dialog box.

Select Preview features and check the box for Visual calculations
Once you've done this, you'll need to restart Power BI Desktop to enable the visual calculations feature.
Creating a Simple Visual Calculation
To create a visual calculation you need a visual to add it to! Here's our example visual:
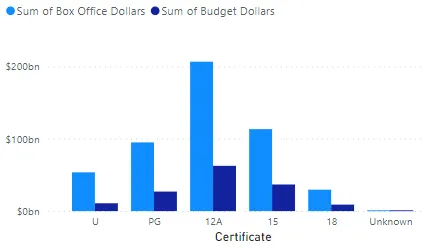
The chart shows the total budget and box office of films, grouped by certificate.
The fields used in the chart come from two tables in the data model:
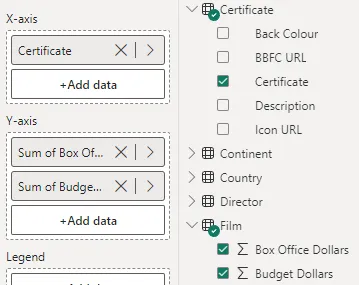
We're using fields from the Certificate and Film tables.
To add a visual calculation to the chart, first select it and then from the ribbon choose Home | New calculation

Select this option in the Calculations group.
When you do this, the screen layout changes to focus on the selected visual and expose the data table which populates it.
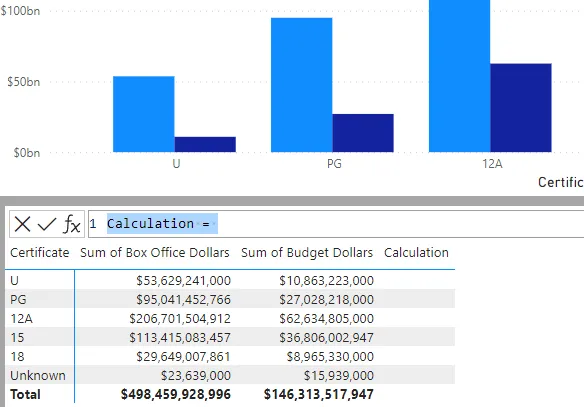
The lower half of the screen shows the data table which populates the selected visual. The formula bar above this table is where you add your visual calculation.
Now you can write your calculation in the formula bar which sits just above the data table. For this example, we'll calculate the profit for each certificate by subtracting the total budget from the total box office.

Start by giving the calculation a name then continue to create a DAX expression in the usual way.
In a visual calculation you can only refer to fields which you've added to the visual. In our example we can only refer to [Certificate], [Sum of Box Office Dollars] and [Sum of Budget Dollars] as those are the only fields in the visual.
Press Enter to finish creating the calculation and see the results.
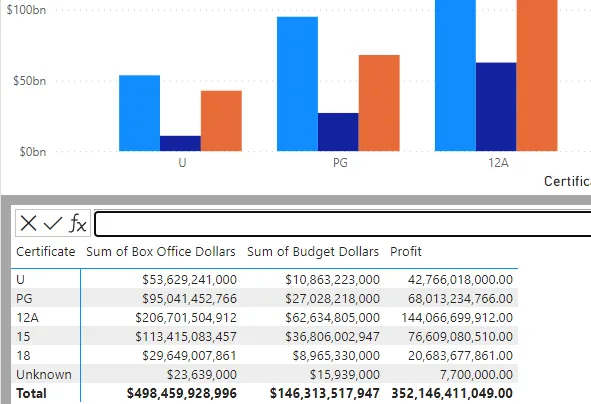
The results of the calculation will automatically appear in the visual.
To return to the normal report view you can click the Back to report link at the top left of the visual.

Click here to return to the regular report view.
The visual calculation appears in the field well for the visual, just like any other field.
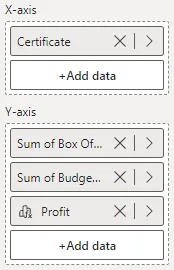
A visual calculation appears with a special icon in the field well.
Editing a Visual Calculation
You can make changes to a visual calculation using the field well of the selected visual.
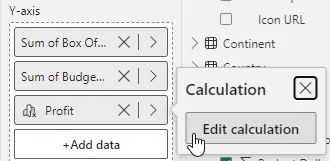
Click the > symbol to see the Edit calculation option. Select this option to modify the calculation you created.
You can see other choices for modifying the visual calculation by right-clicking it in the field well.
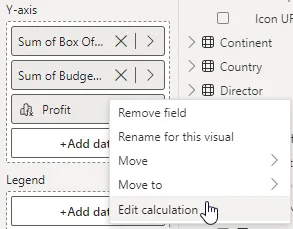
Right-click the visual calculation to see this list of options.
Deleting a Visual Calculation
Deleting a visual calculation is easy!

Click the X next to the visual calculation in the field well to remove it from the visual.
Note that a visual calculation is stored only in the visual that it belongs to. If you delete the calculation (or the visual that it belongs to), it's gone for good! At the time of writing, you aren't asked to confirm that you want to delete a visual calculation, so do this with caution!
Formatting a Visual Calculation
At the time of writing, you can't format a visual calculation in the same way as a calculated column or a measure.

After creating a calculated column or measure, you can use a special tab in the ribbon to apply formatting to the values.
To format a visual calculation, you must rely on the formatting options of the visual it belongs to.
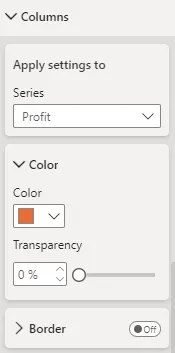
You can select the visual calculation to change some of its formatting properties in the formatting pane.
Hiding Fields in a Visual
In our example we need to include the budget and box office fields in the visual in order to create our visual calculation. This doesn't mean that the fields need to be displayed, however. You can hide fields in a visual using options in the field well. To do this, you must be editing a visual calculation.
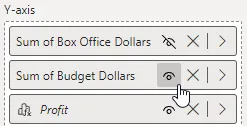
When editing a visual calculation you can choose to hide a field by clicking the eye symbol next to it in the field well.
This means that you can include as many fields in the visual as you need for the calculation, but display only the results of the visual calculation.
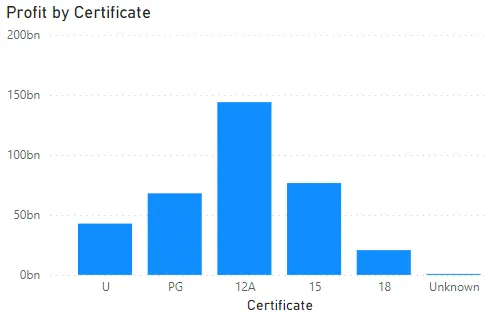
The final result is a cleaner looking visual.
So What?
At this point you're probably thinking that visual calculations aren't that useful (admittedly, the example we used didn't really highlight their benefits). The next part of this blog series introduces some of the new functions available to visual calculations, which might just change your mind!


