How do you pin down Power BI when it changes every month? This is a problem we've wrestled with over the years. Our solution is to do big updates over 18-24 months. Here's the recent history of these major updates, in reverse chronological order:
Month | Update |
|---|
March 2024 | We've just updated all of our Power BI manuals from a February 2022 base. |
September 2023 | We updated our DAX manual. |
February 2022 | We updated our Power BI courseware to include all updates since October 2021. |
October 2021 | We updated all of our Power BI manuals since May 2020. |
May 2020 | We updated our Power BI manuals to include the new ribbon and other changes. |
So what does the new March 2024 update include? I'd say you can divide the changes into 5 main categories, as explained under separate headings below.
Change 1 - On-object interaction
To include this change, or not? It's still in preview:
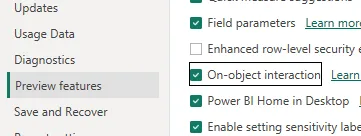
This option is not ticked by default.
Cosmetically, ticking this option makes a huge difference. Here's a screen-shot of a line chart's formatting without on-object interaction:
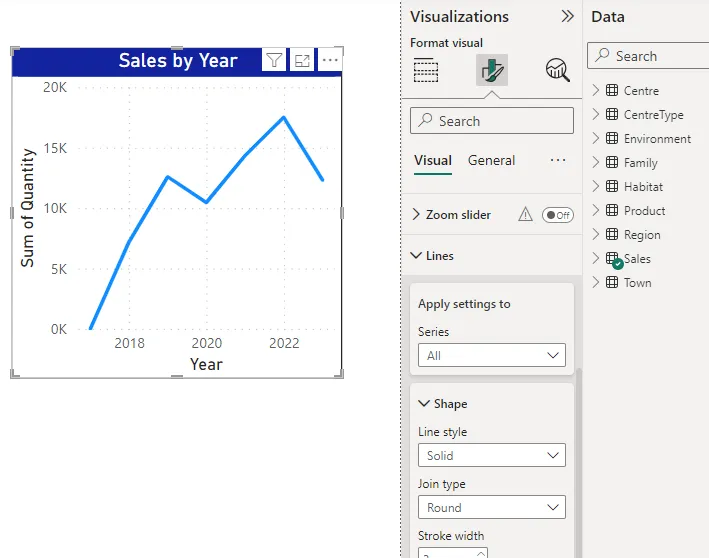
The version of Power BI that most people will see.
Here's roughly the same screen with on-object interaction enabled:
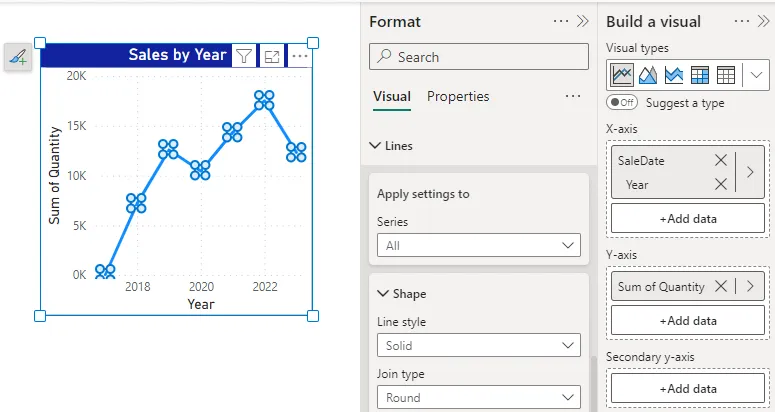
The main difference is in the way in which format properties are presented.
We decided to include on-object interaction in the courseware update. For courses from the start of March onwards we will show delegates what Power BI looks like with on-object interaction enabled, but then teach the course with it disabled.
This obviously means that delegates' courseware won't exactly reflect their experience of Power BI, but in practice this has always been true: it would be impossible to get every delegate to receive courseware fine-tuned to the version of Power BI Desktop that they use.
Change 2 - green is the new yellow
This irritating change meant that we've had to replace virtually every single screen-shot in our Power BI courseware:
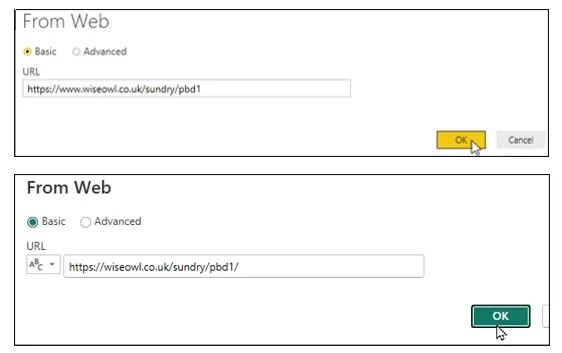
Before-and-after dialog boxes showing the colour change.
This may not seem that important, but it doesn't look good when all the manual screen shots look different from what people see on their screens.
Change 3 - cumulative changes
Much has changed in the last 24 months in the Power BI world (you can see a list of all the updates to Power BI Desktop here). Here's a quick summary of all the changes which we've incorporated in our revamp:
Update | Highlights |
|---|
December 2024 | Lots of new formatting options for bar and column charts, data labels in any chart and Azure Maps cluster charts. |
November 2023 | Button slicers, adding reference labels to cards, a new DAX query editor. |
October 2023 | Opening reports from and saving reports to OneDrive and SharePoint. |
September 2023 | Formatting visuals interactively in mobile layout and adding new linguistic relationship rules to Q&A visuals. |
August 2023 | A new button to switch between mobile and report layouts. |
July 2023 | Smoothing and leader lines for line and area charts. |
June 2023 | The new card visual. |
May 2023 | The Azure Map visual and Optimize ribbon, and measures for chart data labels. |
April 2023 | Modern visual tooltips. |
March 2023 | Subtitles, clear/apply slicer actions and PowerPoint story-telling |
February 2023 | A new relationship editor, tweaks to conditional formatting, themes, text boxes and page navigators. |
December 2022 | Changes to slicer formatting. |
November 2022 | Field parameters to create dynamic slicers and different Y axes for different small multiple charts. |
October 2022 | Changing the stack order of column and bar charts. |
September 2022 | Formatting mobile reports differently, small changes to hierarchical charts and default column titles in tables. |
August 2022 | Conditionally formatting the font colour of data labels. |
July 2022 | Chart error bars. |
June 2022 | Subtle improvements to the table visual. |
May 2022 | Zooming in and out in a report, and using a rectangular lasso to select data points in some chart types. |
April 2022 | A few new formatting options for matrices and for chart legends. |
Change 4 - new cards and slicers
We've included these two exciting new visuals in our courseware (both are in preview, but new cards are turned on by default). Here are sone examples of new cards:
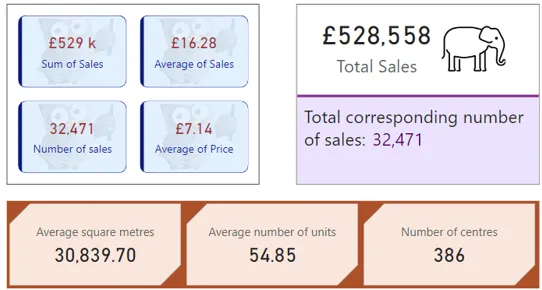
Examples of the new card visual.
Here's an example of the new slicer visual:
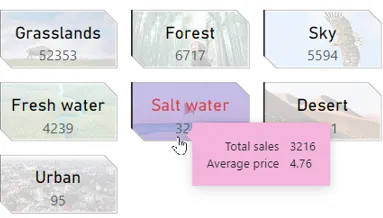
An example of the new slicer visual (with a modern tooltip showing too).
Change 5 - Azure maps
We've done what Microsoft clearly want to do, and have consolidated our map teaching into a single visual - Azure maps:
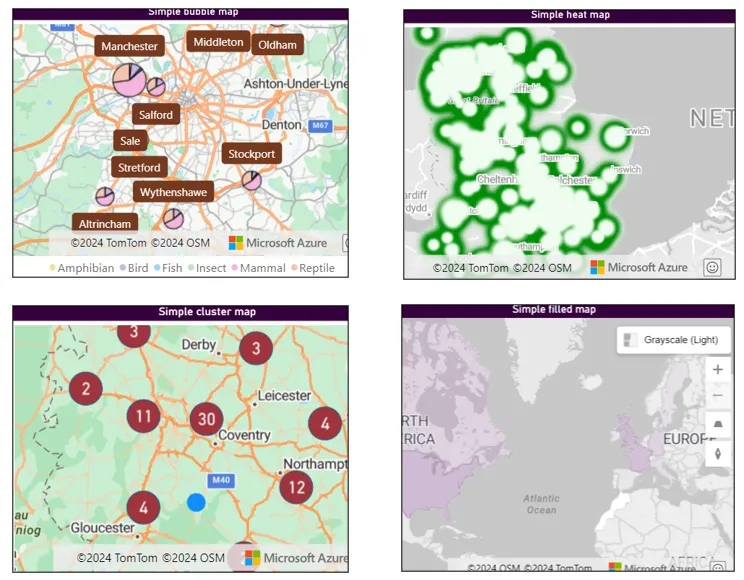
Four examples of the Azure Maps visual.
I blogged on Azure maps when they first came out way back in June of last year, and reported that I was underwhelmed because they seemed a bit buggy and VERY slow to refresh. I'm pleased to say that these problems have gone, so I've now written a full guide to using Azure maps to do this excellent new visual justice.
From 1st March all of our Power BI delegates will get our new courseware (we're also working on a brand new suite of exercises which we hope to roll out soon). We hope you enjoy reading about all the whizzy new things Power BI has to offer!


