Read our blogs, tips and tutorials
Try our exercises or test your skills
Watch our tutorial videos or shorts
Take a self-paced course
Read our recent newsletters
License our courseware
Book expert consultancy
Buy our publications
Get help in using our site
551 attributed reviews in the last 3 years
Refreshingly small course sizes
Outstandingly good courseware
Whizzy online classrooms
Wise Owl trainers only (no freelancers)
Almost no cancellations
We have genuine integrity
We invoice after training
Review 30+ years of Wise Owl
View our top 100 clients
Search our website
We also send out useful tips in a monthly email newsletter ...
Showing the top N values of a dimension, where you can use a slicer to vary N |
---|
Following a question from a Power BI course, this blog shows how you can get a page to show the top N customers by sales value, where N is a number controlled by a slicer. |
In this blog
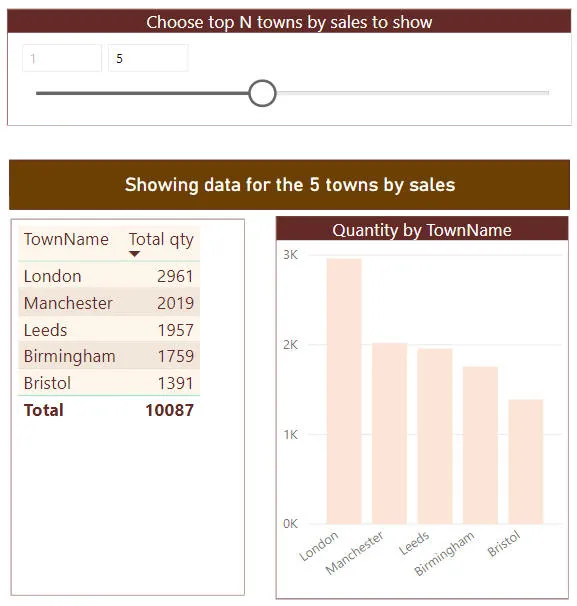
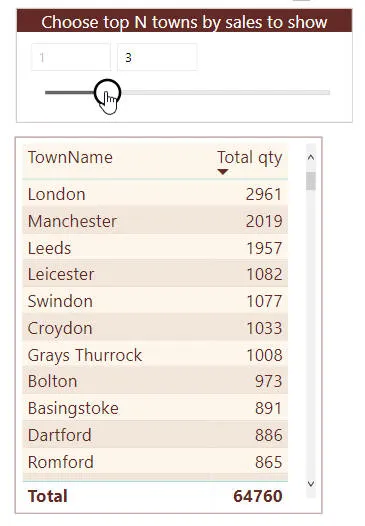
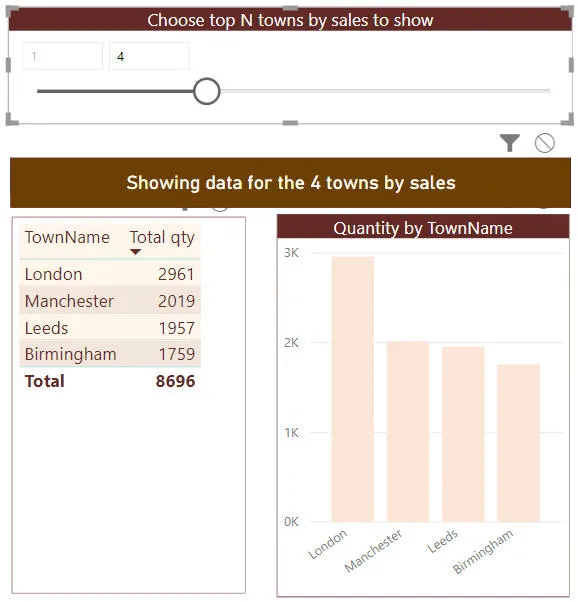
Someone asked me on a course yesterday whether you can achieve this:
The idea is that you should be able to change the number using the slicer at the top of the report, and all of the visuals on the page should then only show data for the top N customers by sales (or in my case, the top N towns by quantity).
I have found a way, although as is always the case I don't know if it's the only way, or even the best one. Here goes!
This blog is aimed at people with a reasonable existing knowledge of Power BI - newbies beware!
Start by creating a what-if parameter:
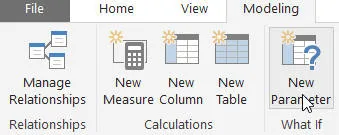
Click on this icon to create a what-if parameter.
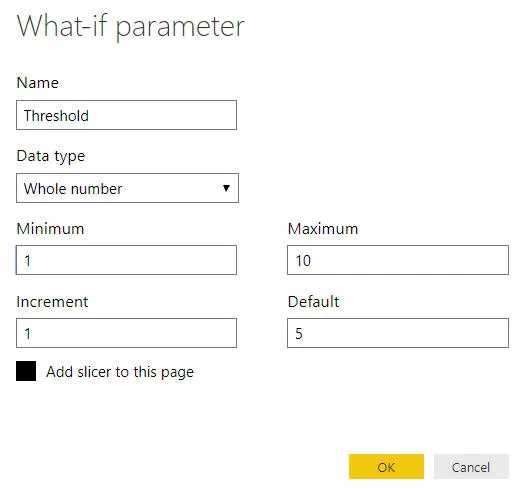
I've set mine to go from showing the top 1 town to the top 10 towns:
The values for our parameter.
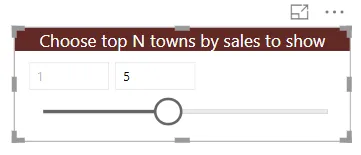
This gives me my slider:
I've added a title and some formatting, and hidden the slicer header.
Note that if you change your mind about the highest value at any point, you can just change the parameters to the GenerateSeries function created:
To do this you should first click on the table as shown.
Here's how to edit the DAX formula for the table:
The numbers in the formula give the minimum and maximum rankings, and also the step value when you use the slicer. You can change these numbers to any you like!
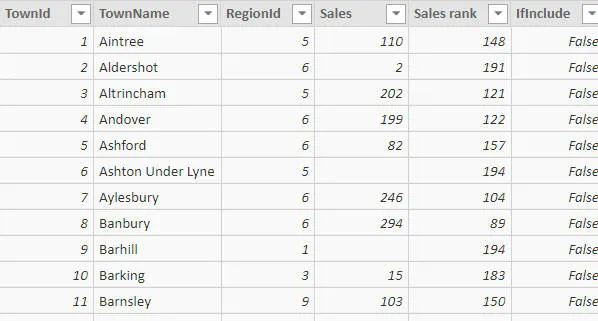
Now go to your table containing the things you want to rank by (towns, customers, whatever) and create 3 new columns:
See below for what to put for each of the last 3 columns.
The [Sales] column above should show the total sales for each town, so that you can then rank them:
Sales = CALCULATE(SUM(Purchase[Quantity]))
Note that you need the CALCULATE function because you need to create filter context for each town, to avoid just summing across the entire table.
The [Sales rank] column should show the position of each town in order:
Sales rank = RANKX(Town,[Sales],[Sales],DESC,Skip)
This ranks the towns by their sales in descending order.
Finally, the [IfInclude] column should say whether each town could possibly be included:
IfInclude = IF(Town[Sales rank] > 10,FALSE(),TRUE())
You'll see in a bit why we need this!
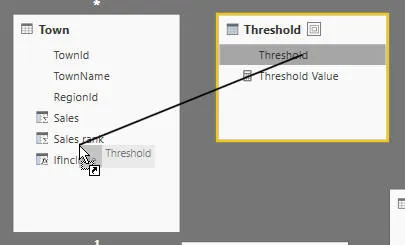
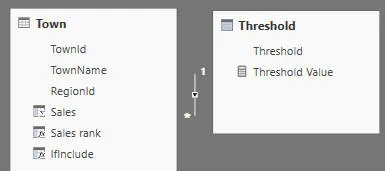
We want the choices made for your parameter to change which towns are displayed, so create a relationship between (in our case) the Town and Threshold tables:
Drag the threshold value onto the [Sales rank] column.
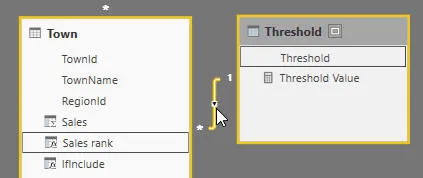
This creates the relationship between the two tables:
The relationship created.
The problem remaining is that the slicer doesn't work!
No matter what number you select in the slicer at the top of the page, you still see all of your towns.
The reason for this is that Power BI doesn't create inner joins between tables, but outer joins. When you select to show the top 3 towns by sales in the slicer, the filter context for the Threshold table looks like this:
The values selected by the slicer shown above.
The relationship between the two tables will mean that any visual will show all of the towns where the sales rank is 1, 2 or 3, but also (by default) all towns where there is no match found:
This is not an inner join, so you'll see towns which have no matching thresholds.
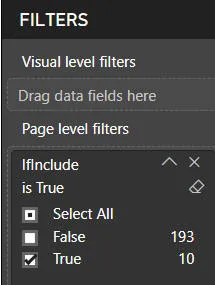
My solution to this was to create a page (or report) filter to exclude these "blank" matches:
This is what the IfInclude calculated column was for - only show towns where the value of this is True (ie which are in the top 10 by sales).
It's not really part of this blog, but just in case it's left you scratching your head the following title was created as a card visual:
To show this create a card, and use it to show the measure shown below.
The card is displaying a measure with this formula:
Chosen =
"Showing data for the " &
MAXX(VALUES(Town[Sales rank]),[Sales rank]) &
" towns by sales"
Again, I don't claim that this is the only way to do this, or even the best. If you're not that familiar with DAX you may prefer to miss this bit of the blog out.
The result is very nearly perfect:
It would be nice not to have to hard-code in the maximum top N value that you could ever want, but I can't see any way round this.
Hope this works for you!
Some other pages relevant to the above blog include:
Kingsmoor House
Railway Street
GLOSSOP
SK13 2AA
Landmark Offices
99 Bishopsgate
LONDON
EC2M 3XD
Holiday Inn
25 Aytoun Street
MANCHESTER
M1 3AE
© Wise Owl Business Solutions Ltd 2024. All Rights Reserved.