Read our blogs, tips and tutorials
Try our exercises or test your skills
Watch our tutorial videos or shorts
Take a self-paced course
Read our recent newsletters
License our courseware
Book expert consultancy
Buy our publications
Get help in using our site
544 attributed reviews in the last 3 years
Refreshingly small course sizes
Outstandingly good courseware
Whizzy online classrooms
Wise Owl trainers only (no freelancers)
Almost no cancellations
We have genuine integrity
We invoice after training
Review 30+ years of Wise Owl
View our top 100 clients
Search our website
We also send out useful tips in a monthly email newsletter ...
Find out how dynamic arrays in Excel will change your (working) life! Part six of a six-part series of blogs |
---|
Dynamic arrays are a new feature being rolled out in Excel 365. This blog explains how they work, and why they will make so many things in Excel easier.
|
In this blog
What's exciting about dynamic arrays is not the technology, but how you can apply it (actually, I think that's true of any technology). Below are 3 ways in which dynamic arrays are going to change your Excel working life.
If you make regular use of range names, your life is about to get easier. Let's first just create a couple of range names. In the spreadsheet below, imagine that you select the block of cells shown selected and press SHIFT + CTRL + ENTER:
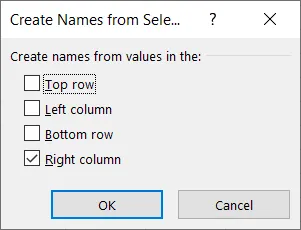
We want to create two range names: Sales and Costs.
You can then choose to apply the names in the right-hand cells to the ranges to their left:
Choose OK to create our two ranges.
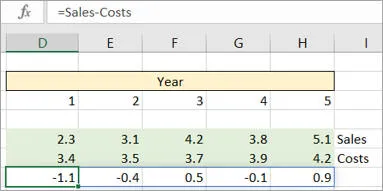
So here's the thing. When you want to calculate profits, you used to have to type in =Sales-Costs and copy the formula across:
For each of the 5 years in the model, the forecast profits will equal forecast sales minus forecast costs.
When you press Enter in the above example, you now get a spill range:
The formula automatically enters figures in the Profit row.
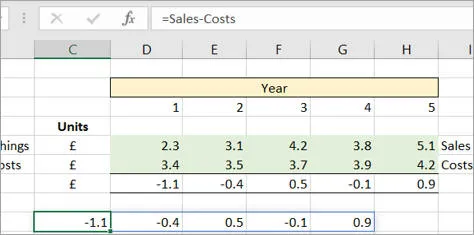
However, it's even better than that! Range names no longer have to start in the same column as the formula they reference:
This formula starting in column C still works, even though it references ranges which start in column D.
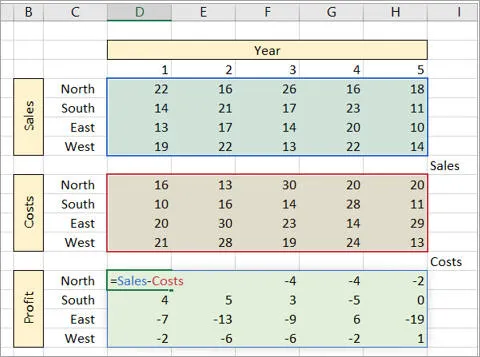
You can even use range names containing more than one row in a formula:
This formula will give the profit for each year and region (without dynamic arrays, it would have given an error message).
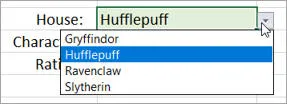
Suppose that you want to achieve a cascading drop list like this. First you choose your Hogwarts house:
You can use data validation to base the choice in a cell upon a list.
You should then be able to choose your character in this house:
The values in the second drop list should depend on the choices you made in the first.
You can do this in pre-dynamic-array Excel; it's just really hard (involving using range names based on the OFFSET function, among other things).
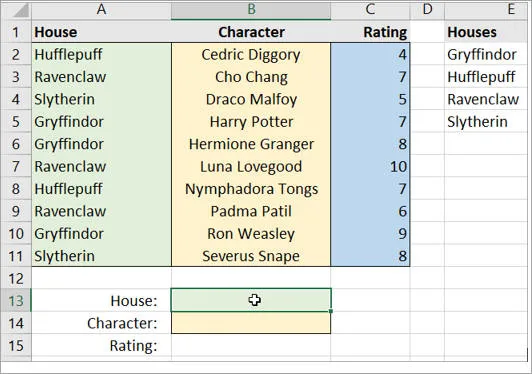
In new Excel this is all now fairly straightforward to create. First create the range listing the houses:
This formula will list out the unique house names in the range in column A, sorted alphabetically.
Next create your data validation:
Select the cell shown (B13), and choose the Data Validation option on the Data tab of the ribbon.
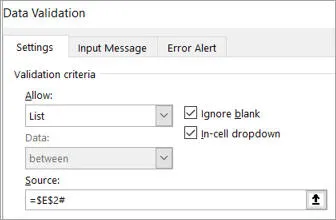
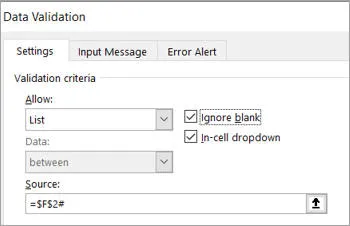
Set the range upon which you want to base your list to be the one containing the list of houses:
The # at the end of the source reference is vital - it tells Excel to use the spill range for this cell, and not just E2 on its own.
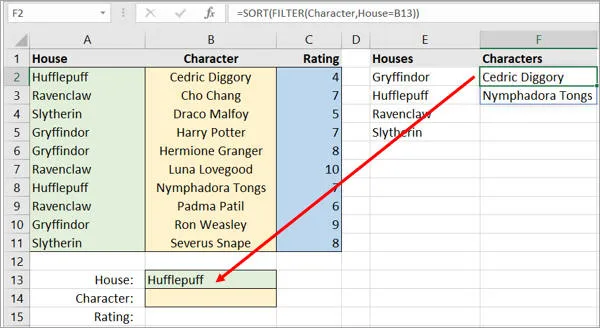
Now create the second range, listing the characters who belong to the house you've chosen:
The formula lists out (in alphabetical order) all of the characters whose house name matches the one chosen in cell B13.
You can then repeat the validation setting to choose a character. First select the cell:
Choose the cell in which a user should be able to choose a character.
In data validation, set the list source range to be the spill range beginning at F2:
Set the source to list out the characters matching the house you've chosen (again using a # character to denote the spill range).
The magic begins!
You have to have tried solving this in old Excel to appreciate just how good this is!
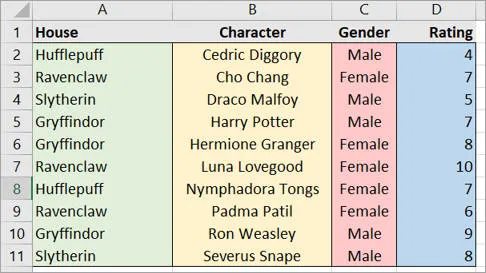
I've now added a column to my table giving the gender of each person:
I presume Nymphadora was female? I'm pretty sure about the others.
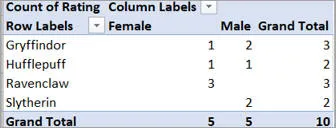
I want to analyse the data, so I create this pivot table:
A pivot table showing the number of characters for each house and gender.
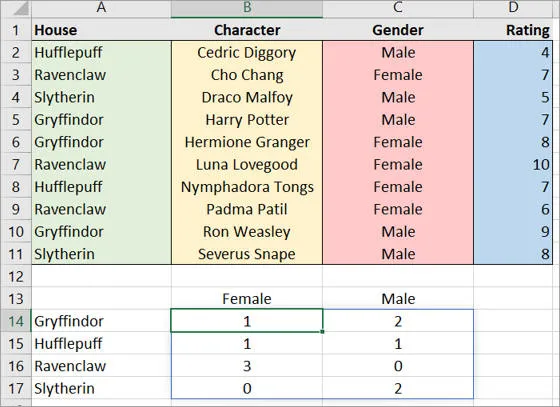
The problem I've got is that whenever I add more characters, I have to refresh the pivot table. Dynamic arrays allow you to create something which looks like a pivot table, but which is linked directly to the underlying data.
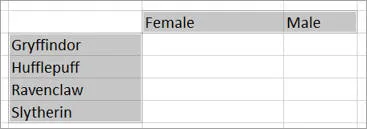
To create this, first get the row and column headings:
See below for the formulae used in each case.
Here are the formulae I've used:
What | Formula |
---|---|
Row headings | =SORT(UNIQUE(House)) |
Column headings | =TRANSPOSE(SORT(UNIQUE(Gender))) |
The second formula takes the gender column, picks out the unique values, sorts them and then transposes the result so that they go across instead of down.
Now for the clever bit - showing this:
The final formula should show the number of characters whose house matches the house in the row label on the left, and whose gender matches the gender at the top.
The formula for the above screen shot is this:
I've just checked, and this is an impressively short 33 characters long. What it does is to count how many rows there are where:
Very clever indeed!
Parts of this blog |
---|
|
Some other pages relevant to the above blogs include:
Kingsmoor House
Railway Street
GLOSSOP
SK13 2AA
Landmark Offices
99 Bishopsgate
LONDON
EC2M 3XD
Holiday Inn
25 Aytoun Street
MANCHESTER
M1 3AE
© Wise Owl Business Solutions Ltd 2024. All Rights Reserved.