Cumulative totals using DAX in Power BI
So Joanne on my course yesterday asked how to get cumulative totals like this:
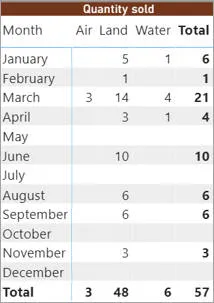 | 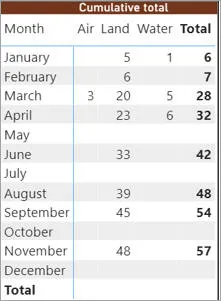 |
How to turn normal figures ... | ... into cumulative totals |
It turns out that (as is so often the case with DAX) solving the basic problem isn't too hard, but making sure it works under all circumstances involves adding a few bells and whistles.
If you want to follow along, you can download the final report file containing the data and the measures here, although you'll find it easier to follow if you've attended either our classroom or online DAX course.
Creating a basic measure
Let's start with solving the basic problem:
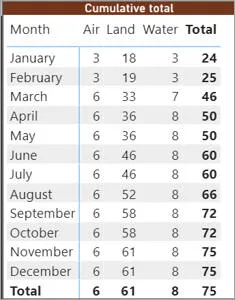
We will calculate the cumulative total over months, but it won't exclude data from previous years or show a blank for months where there's been no activity ... not yet, anyway.
Here's a measure to do the trick:
Cumulative qty sold 1 =
VAR LastDateInPeriod = MAX('Calendar'[DateKey])
RETURN
CALCULATE(
SUM(Purchase[Quantity]),
FILTER(
ALL('Calendar'[DateKey]),
'Calendar'[DateKey] <=>
)
)
The most important thing probably to note about this measure is that we've used a variable to work out the last day in the current period. Here are two true statements about variables:
They are never necessary.
They always make formulae easier to understand.
To see what this formula does, consider this cell:
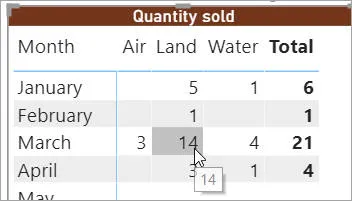
We'll look at this figure, containing the data for March 2017 for the Beaumont Shopping Centre (there are a couple of slicers in the report restricting the data we see).
The variable LastDateInPeriod will be set to hold the value 31st March 2017, since for the filter context of calendar dates for this cell this is the last entry (we could have used the LastDate function here instead, perhaps more elegantly). Then comes the key bit:
FILTER(
ALL('Calendar'[DateKey]),
'Calendar'[DateKey] <=>
)
This would calculate the total quantity sold for all of the dates (that is, every date in our calendar), because it removes the filter context with the ALL function. However, it then adds an alternative constraint: that the date for each purchase must be less than or equal to 31st March 2017.
Excluding figures from prior years
The next task is to exclude data from before the start of the year (for our example, any purchases made before 2017):
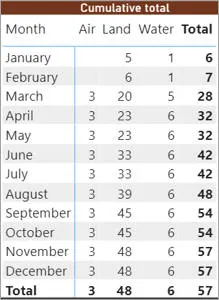
This data is now correct: it shows cumulative totals for the current year only.
To do this, extend your measure like this:
Cumulative qty sold 1 =
VAR LastDateInPeriod = MAX('Calendar'[DateKey])
//
VAR ThisYear = IF(
COUNTROWS(DISTINCT('Calendar'[YearNumber])) = 1,
VALUES('Calendar'[YearNumber]),
BLANK()
)
RETURN
CALCULATE(
SUM(Purchase[Quantity]),
FILTER(
ALL('Calendar'[DateKey]),
'Calendar'[DateKey] <= lastdateinperiod="">
VALUE(YEAR('Calendar'[DateKey])) = VALUE(ThisYear)
)
)
We calculate another variable ThisYear to hold the current year for each cell in the matrix (ie for each filter context). If there is more than one such year (perhaps because we're looking at a totals row with no slicer value for the year), this returns a blank. The filter expression is now more complicated:
'Calendar'[DateKey] <= lastdateinperiod="">
VALUE(YEAR('Calendar'[DateKey])) = VALUE(ThisYear)
We're summing purchases made before the end of the current period, but with an additional constraint that they should have been made in the current year.
The VALUE function turns a text value into a number (the calendar year is being stored as a text value). I have to be honest: I couldn't see why I needed this on either side of the equation, but it wouldn't work without this.
Showing blanks for empty months and for totals
Finally, we need to extend our measure to show blank values where there are no purchases in the corresponding month:
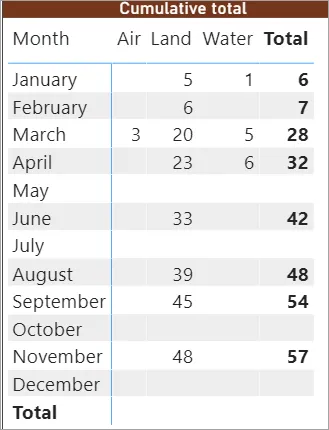
The holy grail!
Our measure is now getting complicated, but by building it up bit by bit, using variables, indenting our formulae and adding frequent comments, it's still just about manageable:
Cumulative qty sold 3 =
VAR LastDateInPeriod = MAX('Calendar'[DateKey])
VAR NumberPurchasesForPeriod = COUNTROWS(Purchase)
VAR ThisYear = IF(
COUNTROWS(DISTINCT('Calendar'[YearNumber])) = 1,
VALUES('Calendar'[YearNumber]),
BLANK()
)
RETURN
// any purchases for this month, or if we're not
// showing one month's data, show a blank
IF(
NumberPurchasesForPeriod = 0 ||
ISBLANK(ThisYear) ||
NOT(ISFILTERED('Calendar'[MonthName])),
BLANK(),
CALCULATE(
SUM(Purchase[Quantity]),
// we're doing it for all dates for the current
// year up to the end of the current period
FILTER(
ALL('Calendar'[DateKey]),
'Calendar'[DateKey] <= lastdateinperiod="">
VALUE(YEAR('Calendar'[DateKey])) = VALUE(ThisYear)
)
)
)
This introduces another new variable:
VAR NumberPurchasesForPeriod = COUNTROWS(Purchase)
This counts how many purchases there are for the filter context (in our case, for each month). Here's how this is used:
IF(
NumberPurchasesForPeriod = 0 ||
ISBLANK(ThisYear) ||
NOT(ISFILTERED('Calendar'[MonthName])),
Â
BLANK(),
So we'll show a blank if any one of the following three things is true:
we're looking at a month for which there aren't any purchases; or
We're looking at a time period which spans multiple years; or
we're not filtering by the month (probably because it's a totals row).
And with that, the measure is complete!


