Read our blogs, tips and tutorials
Try our exercises or test your skills
Watch our tutorial videos or shorts
Take a self-paced course
Read our recent newsletters
License our courseware
Book expert consultancy
Buy our publications
Get help in using our site
551 attributed reviews in the last 3 years
Refreshingly small course sizes
Outstandingly good courseware
Whizzy online classrooms
Wise Owl trainers only (no freelancers)
Almost no cancellations
We have genuine integrity
We invoice after training
Review 30+ years of Wise Owl
View our top 100 clients
Search our website
We also send out useful tips in a monthly email newsletter ...
Power BI Reports vs. Paginated Reports |
---|
Confused about the difference between Power BI Reports and Power BI Paginated Reports? Allow this blog to clear up the confusion! |
In this blog
Microsoft's Power BI platform has two different report designer applications for building two very different types of report:
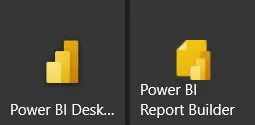
While the icons for the two applications are very similar, the way they work is very different.
Here's a quick summary of the two applications:
Application | Report type | File type |
---|---|---|
Power BI Desktop | Power BI Report | .pbix |
Power BI Report Builder | Power BI Paginated Report | .rdl |
If you've designed reports in SQL Server Reporting Services you'll already know what paginated reports have to offer. What follows is a description of the main differences between the two types of report.
Paginated Reports will automatically create as many pages as required to show all of the data in your report.
In design view, this paginated report is a mere 12mm tall.
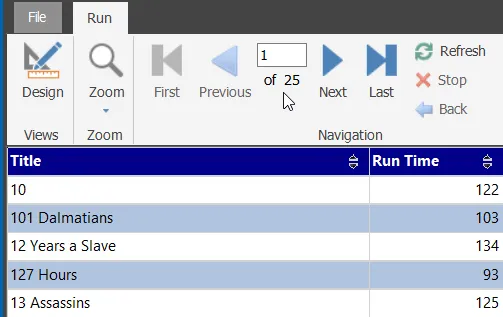
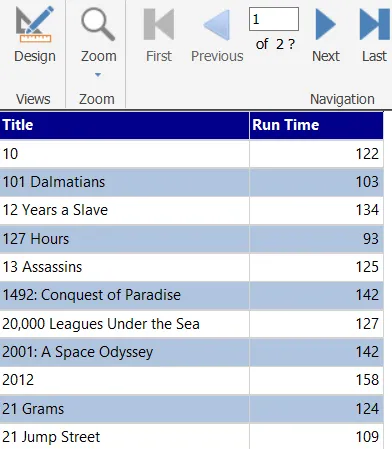
When you run the report, all of the required pages are created for you.
This report has created 25 pages to display all of its data.
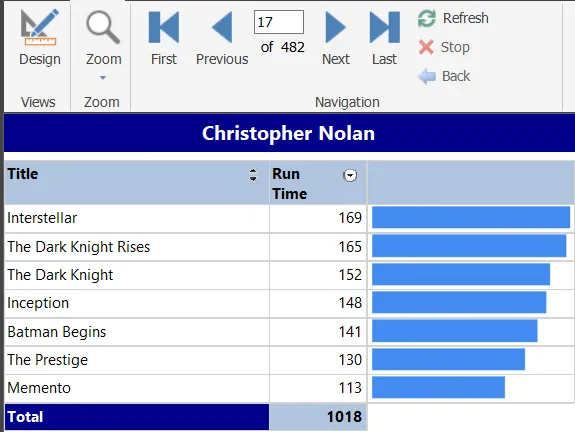
You can also set a Paginated Report to create one page per record or per group in your data.
This report creates one page for each director in the dataset.
In Power BI Reports, the only pages you get are the ones you create yourself.
You can add new pages but Power BI Desktop won't do this automatically.
Pagination has an advantage if you want to print or export your report. In a Paginated Report, you'll print all of the data that your report contains.
Printing this report will print all 25 pages, ensuring that you'll see all of the data.
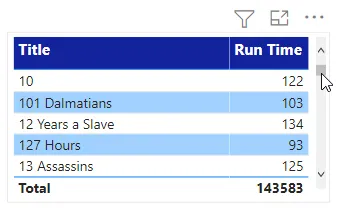
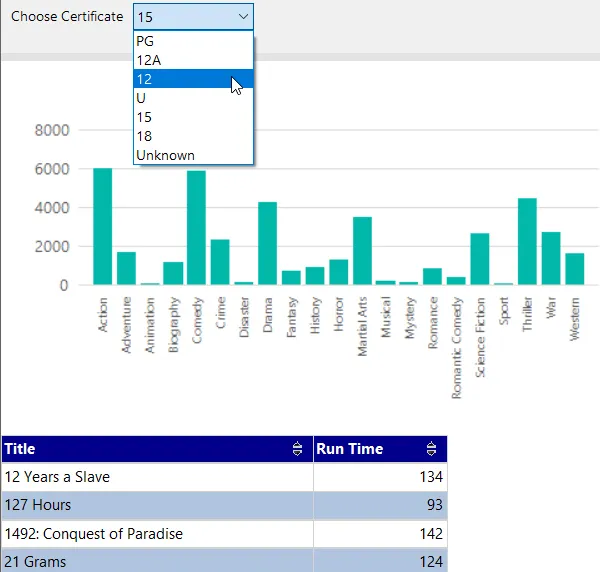
In a Power BI Report, printing a page will print only what is displayed at the time. In the Power BI Report shown below, the table contains 1200 rows but only 5 are visible at any one time. You can use the scroll bar to see the other rows in the live report but, of course, you can't do this in the printed version.
Printing this Power BI Report will print only the rows of the table that are currently visible.
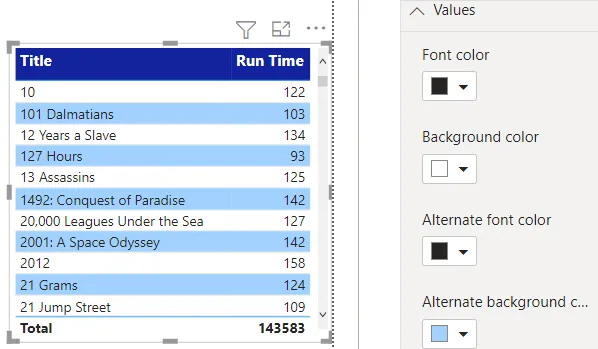
When you design a Power BI Report, what you see is what you get. You can see your design changes immediately, along with the data that your users will see.
You can see the data of your report while you're designing it.
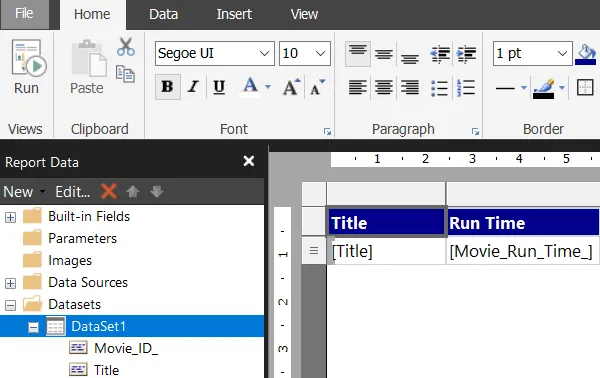
In a Paginated Report you don't see your data while designing the report.
In design view you don't see the data that your report will eventually display.
To see your data you must run the report.
To make changes to the report you'll need to switch back to design view.
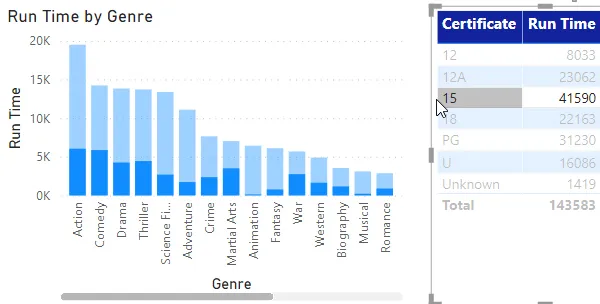
Power BI reports are designed to be interactive as soon as you begin creating them. Indeed, attempting to click on an object without inadvertently sorting its data or filtering all of the other objects on the page can be a frustrating experience!
I only wanted to select the table to change its width but I've accidentally triggered a visual interaction by clicking on a cell.
You have to work a lot harder to create any kind of interactivity in a paginated report.
You can create parameters to filter reports and apply interactive sorting to tables, but you'll have to do all this manually.
In Power BI Reports you write expressions in the DAX language. You can use this language to create calculated columns and measures.
A simple DAX expression to create a calculated column in the data model.
Power BI Desktop also allows you to write expressions in the Query Editor using the M Formula Language.
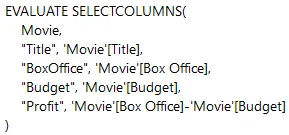
In Paginated Reports you can write DAX expressions in the query which you use to populate a dataset.
Here we're adding a calculated column called Profit.
Power BI Report Builder also allows you to write expressions using VB.NET. This allows you to create calculated columns in much the same way as DAX expressions.
A simple expression in VB.NET to create a calculated column.
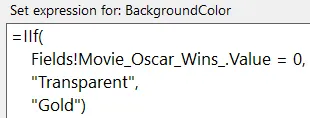
You can also write VB.NET expressions to control the appearance and behaviour of elements of your report.
This VB.NET expression calculates the background colour of cells in a table according to the value of a field.
There are many other differences between the two report designers. If you'd like to see what some of them are, you can book one of our Power BI Desktop courses!
Some other pages relevant to the above blog include:
Kingsmoor House
Railway Street
GLOSSOP
SK13 2AA
Landmark Offices
99 Bishopsgate
LONDON
EC2M 3XD
Holiday Inn
25 Aytoun Street
MANCHESTER
M1 3AE
© Wise Owl Business Solutions Ltd 2024. All Rights Reserved.