Read our blogs, tips and tutorials
Try our exercises or test your skills
Watch our tutorial videos or shorts
Take a self-paced course
Read our recent newsletters
License our courseware
Book expert consultancy
Buy our publications
Get help in using our site
547 attributed reviews in the last 3 years
Refreshingly small course sizes
Outstandingly good courseware
Whizzy online classrooms
Wise Owl trainers only (no freelancers)
Almost no cancellations
We have genuine integrity
We invoice after training
Review 30+ years of Wise Owl
View our top 100 clients
Search our website
We also send out useful tips in a monthly email newsletter ...
Changes in the Power BI Desktop December 2022 update Part three of a three-part series of blogs |
---|
This update make slicer formatting much more consistent (a welcome change), and introduces 3 fairly complex new DAX functions (OFFSET, INDEX and WINDOW).
We've been creating our idiosyncratic monthly blogs on Power BI updates since November 2016, and also deliver online and classroom Power BI courses. |
These aren't for the faint-hearted, but Microsoft are pledging to simplify them over time:
Direction of travel advice from the December 2022 Power BI Desktop update site.
These DAX functions also make use of the new ORDERBY and PARTITIONBY functions. SQL programmers will recognise that these are pretty much direct copies of the ORDER BY and PARTITION BY window functions in SQL, using the OVER clause.
To illustrate these functions, let's first consider the example we'll use.
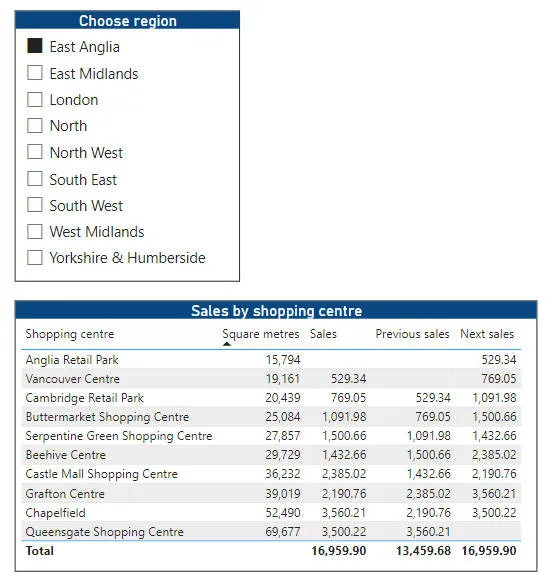
Consider this example report page:
The bottom table shows for each shopping centre the sales it made, together with the sales of the next biggest and next smallest centre.
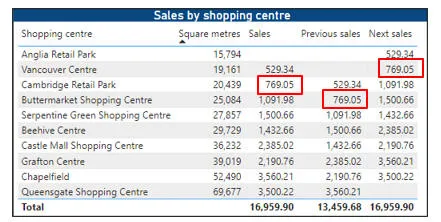
It always helps with these things to focus on one figure, so let's do that:
The sales for Cambridge Retail Park as they appear in the report.
It's reasonably clear what we're doing for this: we're sorting the shopping centres by the square metre area, and picking out for each three things:
Measure | Notes |
---|---|
Sales | The total sales for each centre |
Previous sales | The total sales for the previous centre (if you sort the shopping centres into ascending size order). |
Next sales | The total sales for the next centre (again if you sort the centres into ascending size order). |
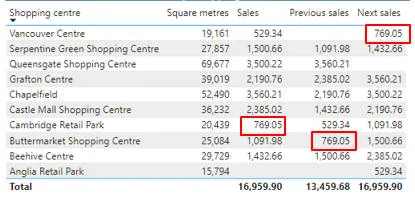
It's less obvious what's going on if you change the sort order for the table:
This is the same data, but this time sorted in reverse alphabetical order by centre name.
The OFFSET function takes up to 5 arguments:
Argument | Name | Notes | Our example |
---|---|---|---|
1 | delta | The number of rows back or forward we should go. | -1 and 1 respectively |
2 | relation | The table from which to get the data. | ALLSELECTED(Centre) (ie the centres for the selected region) |
3 | orderBy | How to order these rows | Centre[SquareMetres],ASC (ie in size order) |
4 | blanks | How to treat blanks | Currently the only allowed value for this is KEEP |
5 | partitionBy | How to group the data | Omitted (we won't group the centres) |
Here is what our Next Sales measure could look like:
Next sales = CALCULATE(
// calculate the total sales ...
[Sales],
// ... for the centre one after this one
// in square metre size order
OFFSET(
1,
ALLSELECTED(Centre),
ORDERBY(Centre[SquareMetres],ASC)
)
)
The Previous sales measure would be the same, but with -1 for the first argument instead of 1.
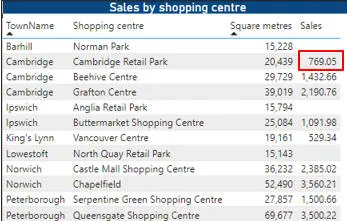
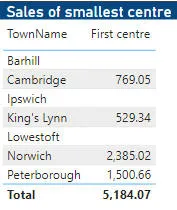
Whereas the OFFSET function allows you to go forward or backwards, the INDEX function allows you to pick out a particular row. For example, we could use this to show sales for the first shopping centre in size order for each town:
Staying with the Cambridge example, we'd expect to see the boxed figure against Cambridge, because this gives the sales for the smallest shopping centre within this town.
Here's what the results for this measure might look like:
For each town we see sales for its smallest shopping centre. For some of these there is no corresponding figure, so the visual shows a blank.
Here's the measure we could use to show this (the syntax of INDEX is similar to that for OFFSET as shown above):
First centre = CALCULATE(
// calculate the total sales ...
[Sales],
// ... for the first centre in size order
// within this town
INDEX(
1,
ALLSELECTED(Centre),
ORDERBY(Centre[SquareMetres],ASC),
KEEP,
PARTITIONBY(Town[TownName])
)
)
That is: pick out the sales for the first shopping centre in square metre size order within those for each town.
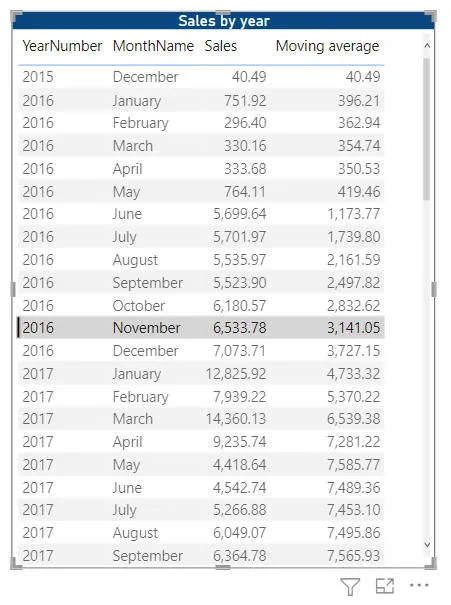
Whereas OFFSET and INDEX pick out single values, the WINDOW function picks out a range of values and may be useful for doing moving averages. Here's an example showing a 12-month moving average of sales:
Moving average = AVERAGEX(
// take the average of the 12 months up to and
// including this one
WINDOW(
-11,
0,
ALLSELECTED(
'Calendar'[YearNumber],
'Calendar'[MonthName],
'Calendar'[MonthNumber]
),
ORDERBY(
'Calendar'[YearNumber],
ASC,
'Calendar'[MonthNumber],
ASC
)
),
[Sales]
)
Here's what this would give for the Wise Owl Create-a-Creature data:
The figure for November 2016 is 3,141.05, which is the sum of the figures from December 2015 through to November 2016 divided by 12 (I've checked!).
My own feeling is that for time-intelligence functions there are at least two easier alternative ways to calculate moving averages!
Parts of this blog |
---|
|
Some other pages relevant to the above blogs include:
Kingsmoor House
Railway Street
GLOSSOP
SK13 2AA
Landmark Offices
99 Bishopsgate
LONDON
EC2M 3XD
Holiday Inn
25 Aytoun Street
MANCHESTER
M1 3AE
© Wise Owl Business Solutions Ltd 2024. All Rights Reserved.