Read our blogs, tips and tutorials
Try our exercises or test your skills
Watch our tutorial videos or shorts
Take a self-paced course
Read our recent newsletters
License our courseware
Book expert consultancy
Buy our publications
Get help in using our site
549 attributed reviews in the last 3 years
Refreshingly small course sizes
Outstandingly good courseware
Whizzy online classrooms
Wise Owl trainers only (no freelancers)
Almost no cancellations
We have genuine integrity
We invoice after training
Review 30+ years of Wise Owl
View our top 100 clients
Search our website
We also send out useful tips in a monthly email newsletter ...
On-object interaction will change completely how you use Power BI |
---|
It's not often that a single Power BI update has such a big impact, but on-object interaction (waiting in preview) is a huge change |
In this blog
Microsoft have just about rewritten the Power BI Desktop user interface, although the change is currently only in preview.
Our policy is not to include preview features in our courses, since a) they may contain bugs and b) they may change before release. Thus we will only include this new feature in our courses once it goes live (we will include it within our courseware a month or so after this date).
So what's changed? Everything, really!
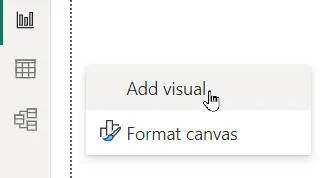
So you will either be able to do this using the short-cut menu:
You'll be able to right-click to add a visual to a report, although interestingly double-clicking no longer adds a Q&A visual (or any other for that matter).
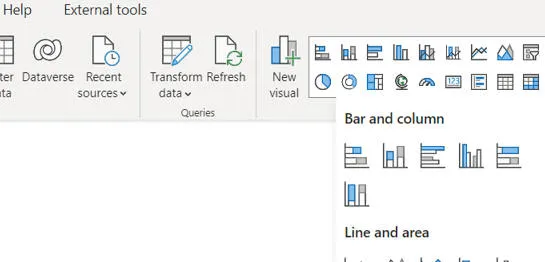
Alternatively, you can use this Excel-style dropdown:
Visuals are sensible divided into categories, making them much easier to find.
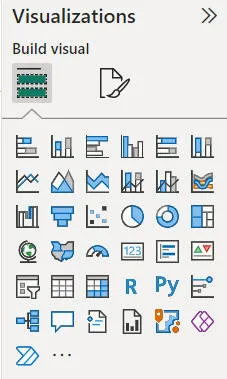
This change means that the Visualizations pane is no longer needed, and has been removed.
I for one won't miss this pane: it always took me ages to find slicers and matrices!
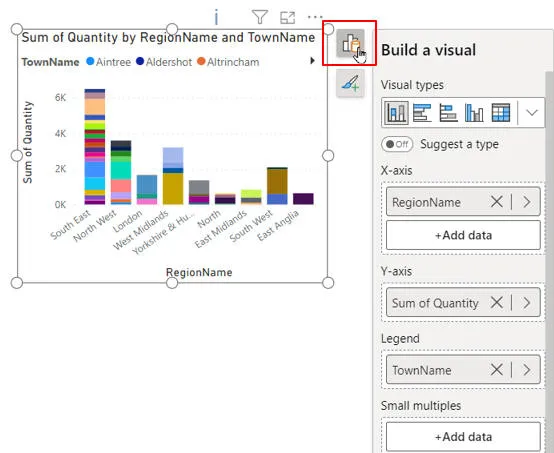
You can now click on this symbol to set the data for a visual:
You can then either click on the Add data button for each card to add fields, or drag fields from the old-style Data pane on the right of Power BI.
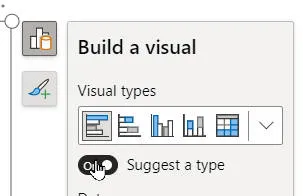
After adding data to a visual you can get Power BI to suggest what type of visual you should use to represent it:
I don't remember seeing the Suggest a type option before...
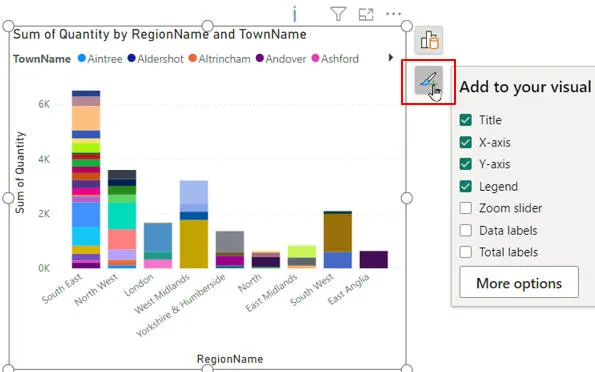
To format a visual (drum roll please) you can click on this icon:
Click on the paintbrush icon to change how your visual appears.
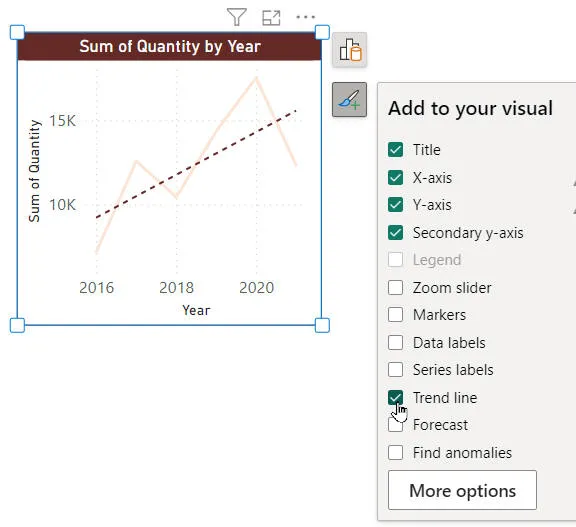
The list of tick boxes changes according to your chart type:
For a line chart, for example, you can easily add a trend line (previously you would have had to click on the Analytics pane icon to do this).
Clicking on the More options button brings up the standard, much-loved right-hand formatting pane.
Possibly my favourite new feature? When you click on part of a visual:
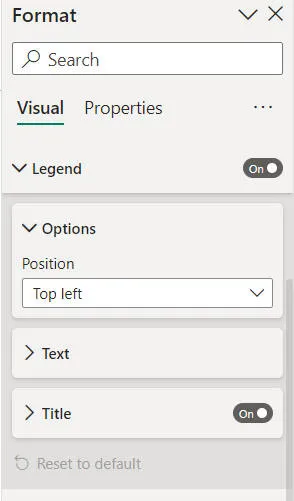
Here I've clicked on the chart legend.
Then Power BI selects the relevant properties for this element in the formatting pane:
This will save so much time previously wasted hunting for the right formatting properties!
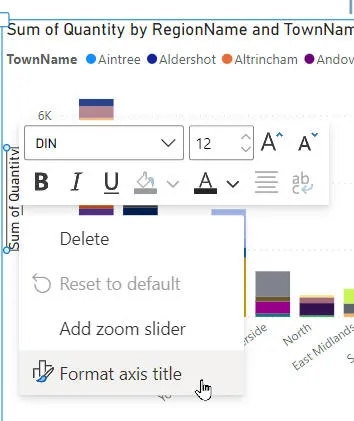
However, there is another way to format format part of a visual. You can - at long last - now right-click on it, although the results are slightly disappointing:
Here I've chosen to format the chart's Y axis title. I can change the title font from the Excel-style pop-up, but if I choose the right-mouse button option shown Power BI just shows the visual element's formatting properties in the right-hand pane.
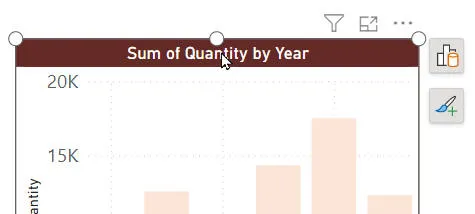
Another welcome feature of on-object formatting is that you can change things like visual titles within the visuals themselves. For example, suppose that you want to change this chart title:
This is the title generated by Power BI, but you want to customise it.
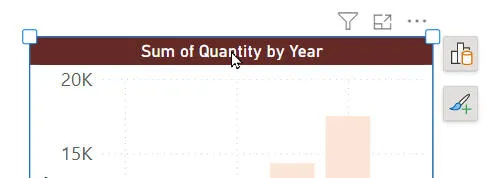
First, double-click on the chart to go into format mode:
The blue border round the visual shows you are now in formatting view.
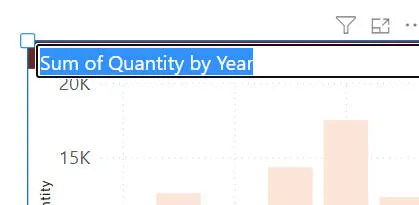
Now double-click on the title, and you can change it!
I feel my life has been leading up to this moment!
You can also change axis titles in the same way, but not (it would seem) table column titles.
Normally we resent having to rewrite courseware when software changes, but this is so clearly a huge improvement to the way that Power BI works that we will forgive Microsoft just this once! Kudos to the Power BI team.
Some other pages relevant to the above blog include:
Kingsmoor House
Railway Street
GLOSSOP
SK13 2AA
Landmark Offices
99 Bishopsgate
LONDON
EC2M 3XD
Holiday Inn
25 Aytoun Street
MANCHESTER
M1 3AE
© Wise Owl Business Solutions Ltd 2025. All Rights Reserved.