Read our blogs, tips and tutorials
Try our exercises or test your skills
Watch our tutorial videos or shorts
Take a self-paced course
Read our recent newsletters
License our courseware
Book expert consultancy
Buy our publications
Get help in using our site
547 attributed reviews in the last 3 years
Refreshingly small course sizes
Outstandingly good courseware
Whizzy online classrooms
Wise Owl trainers only (no freelancers)
Almost no cancellations
We have genuine integrity
We invoice after training
Review 30+ years of Wise Owl
View our top 100 clients
Search our website
We also send out useful tips in a monthly email newsletter ...
Changes introduced in the Power BI Desktop May 2023 update Part two of a five-part series of blogs |
---|
The big event this month is the (long-awaited) release of Azure Maps, but the May 2023 update also includes the official launch of the Optimize ribbon and allows you to use measures as data labels, among other changes.
We've been creating our idiosyncratic monthly blogs on Power BI updates since November 2016, and also deliver online and classroom Power BI courses. |
In this blog
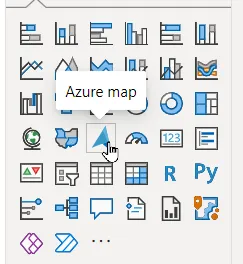
It's taken a very long time (years rather than months), but Azure Maps are finally with us!
The new mapping kid in town!
This is a vast subject, and not one which can reasonably be covered in a single blog: my aim below is just to give a flavour of what Azure Maps are, and whether they are for you.
You may not have a choice, unless you use a third-party tool like MapBox. Microsoft say that (I quote) "in a future release, we will fully deprecate our older map visuals and migrate even existing reports over to Azure Maps in order to truly unify all of our map visuals into one".
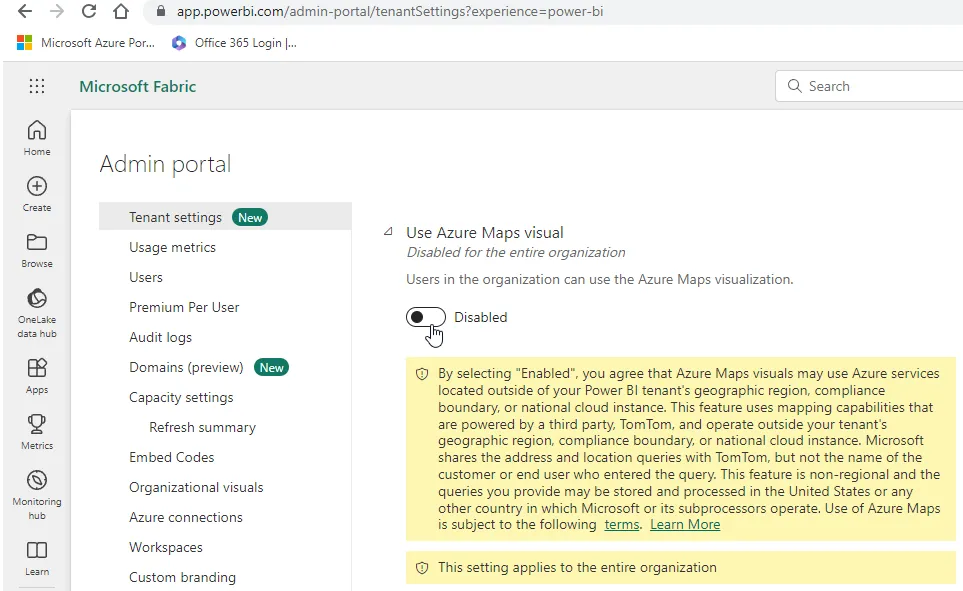
If you try inserting a map in a report, you may well get a message saying that your tenant hasn't got Azure Maps enabled. If this is the case, just ask your friendly Power BI administrator to enable them:
This is how easy it is to enable Azure Maps!
The reason that your organisation needs to enable Azure Maps (I would guess) is that you are agreeing to send some data to Microsoft, without any control over which region this will be processed in. In practice Power BI will send minimal data to the Azure Map engine - just enough to allow it to do what it needs to do, in fact.
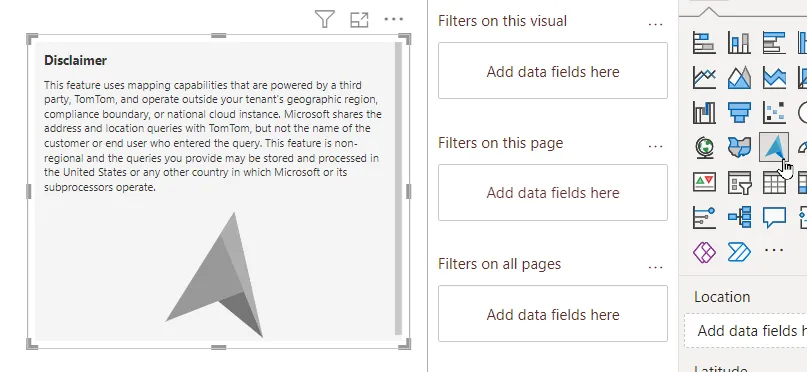
After adding a map, this is what you'll see initially:
A newly created Azure Map visual.
You can either use some recognised location field (here I'm using a UK postcode) or - better - use latitude and longitude fields, if you have them:
The field well for the Azure Map visual.
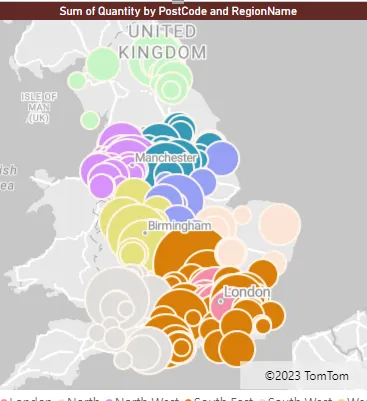
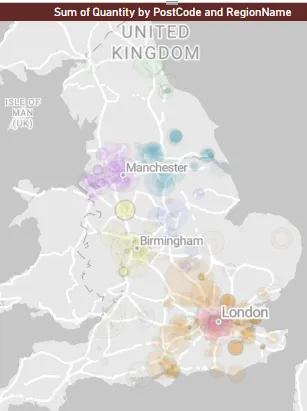
The initial map is promising, but took a LONG time to appear:
Initially I thought I'd done something wrong, but after about 5-10 seconds the regional bubbles appeared. It's encouraging that Azure has managed not to put any postcodes in the US, as previous map visuals have been wont to do!
You can control how your map works using these properties:
For example, you could set the map to auto-zoom round a fixed location.
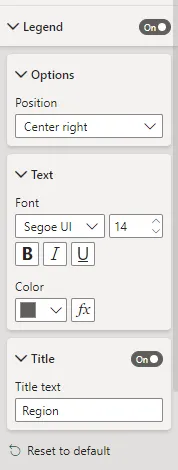
This works pretty much like a normal visual legend - with all of the same limitations:
The options to configure the map legend - here I've positioned mine to the right of the map, with a title saying Region.
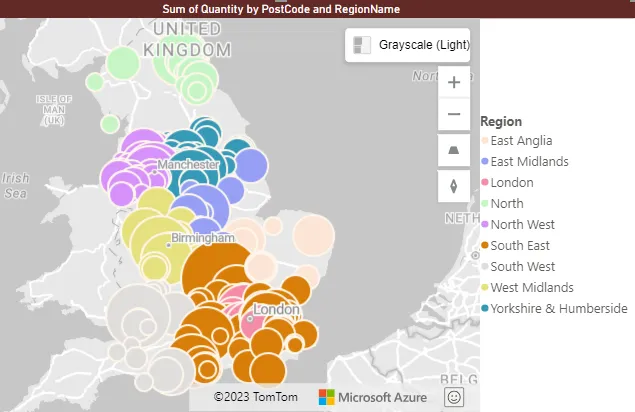
Here's what the setings above would give:
The legend looks odd in this position!
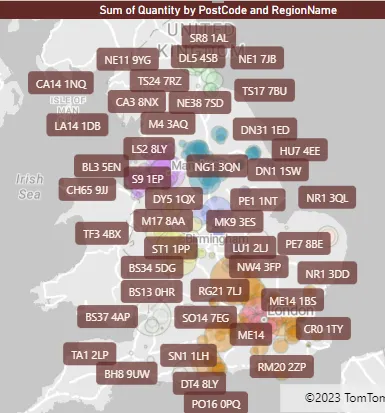
You can change the size of your bubbles (you can even use a log scale to display their relative sizes), and also choose to show category labels, varying the foreground colour, background colour and font size, to produce horrible effects like this!
Just because you can do something doesn't mean that you should ...
Azure Maps allow you to have layers (like transparent sheets containing information stacked up on your map - anyone of a certain age who has used an old-style Overhead Projector will know exactly what i mean by this):
Some layers that you can display.
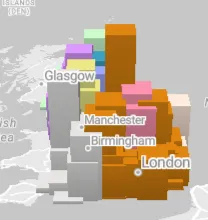
Here's what a 3D column layer could look like:
There are many options for customising the appearance of your columns - which is just as well!
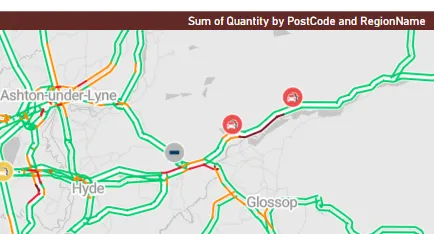
And here's a traffic layer:
The further you zoom in, the more detail you see.
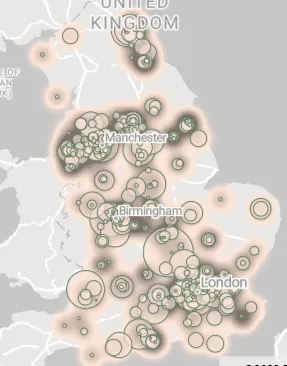
And finally, a heat layer:
I had to remove the Region legend to create this heat map. Again, there are many options for formatting this.
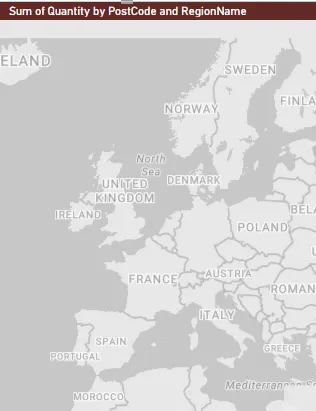
I really wanted to like the Azure Maps visual. I like the fact that it combines and replaces all of the previous map visuals, and it seems to tick all the boxes I expected it to (heat maps, filled maps, traffic, layers, etc). However, I would prefer to be able to choose my mapping provider (Microsoft are now leaning towards TomTom for all of their maps). But the biggest irritation is that almost every time you make a change your Azure Map goes through two changes. Firstly, the map zooms out for a second:
You briefly see a view of Europe, if not the world.
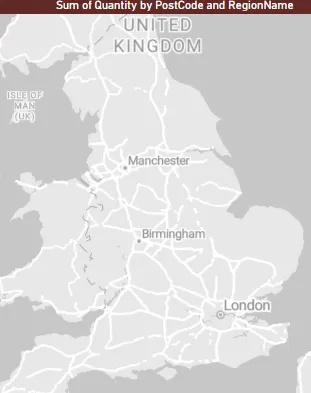
The map then zooms back in, but without showing anything on it:
This blank map makes you (well, me) think I've done something wrong!
But after 5-10 seconds your map finally appears:
Yeah! So I did choose the right fields after all!
Maybe I've got a bad Internet connection, or maybe I've caught Microsoft or TomTom on a bad day, but this display sequence and lag is really disappointing.
Parts of this blog |
---|
|
Some other pages relevant to the above blogs include:
Kingsmoor House
Railway Street
GLOSSOP
SK13 2AA
Landmark Offices
99 Bishopsgate
LONDON
EC2M 3XD
Holiday Inn
25 Aytoun Street
MANCHESTER
M1 3AE
© Wise Owl Business Solutions Ltd 2024. All Rights Reserved.