Read our blogs, tips and tutorials
Try our exercises or test your skills
Watch our tutorial videos or shorts
Take a self-paced course
Read our recent newsletters
License our courseware
Book expert consultancy
Buy our publications
Get help in using our site
542 attributed reviews in the last 3 years
Refreshingly small course sizes
Outstandingly good courseware
Whizzy online classrooms
Wise Owl trainers only (no freelancers)
Almost no cancellations
We have genuine integrity
We invoice after training
Review 30+ years of Wise Owl
View our top 100 clients
Search our website
We also send out useful tips in a monthly email newsletter ...
The new card visual in Power BI Desktop Part three of a three-part series of blogs |
---|
Microsoft have introduced an impressive new card visual in the June 2023 Power BI Desktop update, which blows the old (rather feeble) card visual out of the water!
|
In this blog
Where to start? Microsoft seem to be using the new card as a laboratory in which to experiment with new formatting features, such as choosing which corners of a rectangle you want to round and making fonts transparent. Does the world need this level of sophistication? Not sure!
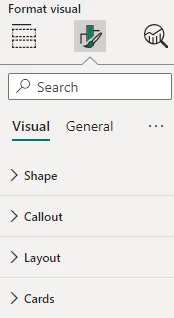
The formatting pane looks so simple for new cards, but looks can be deceviing.
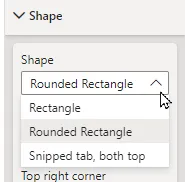
You can choose 3 different types of border:
See below for what snipped tabs are!
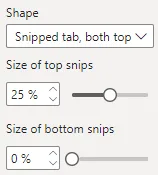
If you choose snipped tabs, you can control how much you want to snip by at top and bottom:
Again, see below for the implications of these choices ...
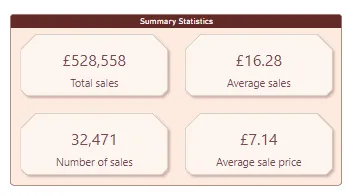
Here's what snipped tabs look like:
These tabs have been snipped by 25% at the top, but only 10% at the bottom.
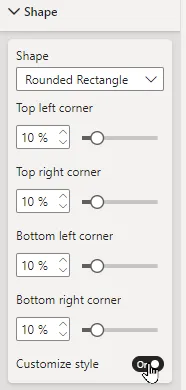
If you just want a rounded rectangle, you can choose how you want to round it by choosing to customise styles:
Click on the option shown to set individual values for each corner.
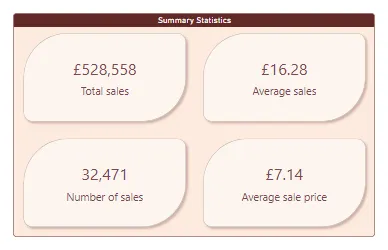
Here's an example of individual corner rounding settings:
Here the top left and bottom right corners are set to 50% rounding, and the other two corners to 10%.
Already getting weary of all the new card formatting options? We've only just begun!
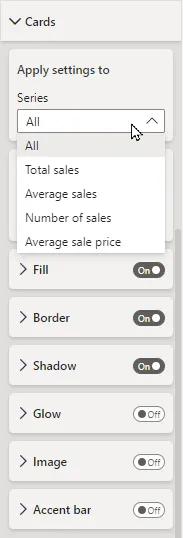
Having set your rounded borders to your satisfaction, you can now set the border, shadow and glow settings for all of your card components - or for any individual one:
A general principle of the new card visual: you can apply formatting to all statistics, or to a specific individual one.
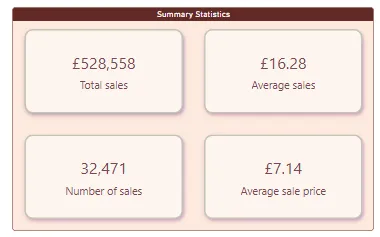
Here I've changed the Border, Shadow and Glow settings for my cards:
See below for what this would give.
The results probably aren't worth the trouble:
The border is a green 3-pixel line with 61% transparency, for example - somewhat hard to detect.
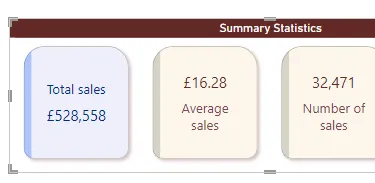
You can set something called an accent bar to make each card component stand out:
The thick vertical bar to the left of each statistics is the accent.
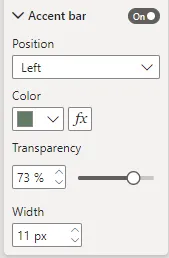
Here's what all but the first accent are set to:
This accent is an 11-pixel wide green bar appearing to the left of each statistic, with 73% transparency.
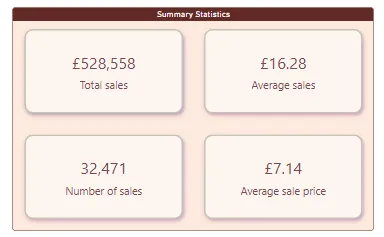
This is probably my favourite formatting innovation - you can set custom formatting for each separate statistic:
The top left statistic has a leading pound sign and no decimal places, for example, while the bottom right one has two decimal places.
You can set number formatting for a statistic by changing Callout formatting:
Here I've set the total sales formatting custom code to be £#,##0. You don't have to use custom number codes, but it does give you complete control.
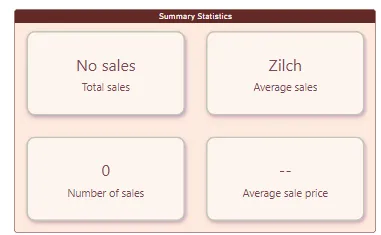
Where there is no data for a particular card statistic, you can specify what should appear:
Here I've set each statistic to show something different (and chosen other options in my report to ensure that there is no data for the current filter context, so I can test how blanks appear).
Here's the relevant card setting for this:
The property controlling how blanks appear.
Most of the other formatting settings for a card are fairly easy to work out. Here's a quick summary:
The remaining formatting options are summarised in the table below.
Here's what each of these card categories allows you to change:
Category | Section | Use this to set |
---|---|---|
Callout | Values | How the number appears for each statistic. |
Callout | Label | How and whether the label above (or below) this number appears. |
Callout | Spacing | The distance between the number and its label. |
Cards | Padding | Padding above, below, to the left and to the right of the card (in pixels). |
Cards | Fill | The background colour for each statistic's panel within a parent card. |
Note that many of these properties can be dynamic (so for example you could set the background colour for each card to be an expression based on a field or measure in your dataset).
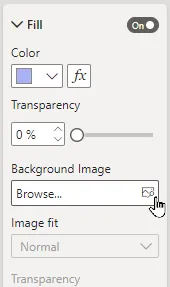
If you've read down to here, I know what you'll be thinking - is that all the formatting you can do with a card?! Fortunately the answer is no, as you can add fill or border images. Here's how to set fill images:
You can add images to the background of cell panels.
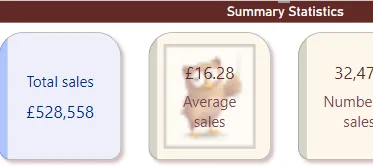
Here's what a fill image set to fit inside its card might look like, with 50% transparency:
A fill image doing what a fill image does best - waiting to be removed!
And here are the options for a border image (yes - it really is an image appearing in the border of a single card statistic's panel):
This is where I think I lost patience with formatting options for the new card visual!
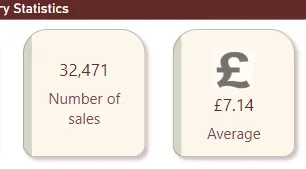
Here's what the above settings would give for a card - the pound sign image 3 pixels above the contents of the card, with 46% transparency:
And with that, I think I've exhausted everything you can do with new card formattting!
Our conclusion? The new card visual is wonderful: it allows you to display multiple statistics in a panel in a consistent way, while tweaking the formatting of each. Microsoft may have gone a tiny bit OTT with the formatting options, however!
Parts of this blog |
---|
|
Some other pages relevant to the above blogs include:
Kingsmoor House
Railway Street
GLOSSOP
SK13 2AA
Landmark Offices
99 Bishopsgate
LONDON
EC2M 3XD
Holiday Inn
25 Aytoun Street
MANCHESTER
M1 3AE
© Wise Owl Business Solutions Ltd 2025. All Rights Reserved.