Read our blogs, tips and tutorials
Try our exercises or test your skills
Watch our tutorial videos or shorts
Take a self-paced course
Read our recent newsletters
License our courseware
Book expert consultancy
Buy our publications
Get help in using our site
542 attributed reviews in the last 3 years
Refreshingly small course sizes
Outstandingly good courseware
Whizzy online classrooms
Wise Owl trainers only (no freelancers)
Almost no cancellations
We have genuine integrity
We invoice after training
Review 30+ years of Wise Owl
View our top 100 clients
Search our website
We also send out useful tips in a monthly email newsletter ...
The new button slicer visual in Power BI Desktop Part two of a three-part series of blogs |
---|
Microsoft have introduced a new button slicer visual in the November 2023 Power BI Desktop update, which adds additional functionality and formatting features to the old tile slicer.
|
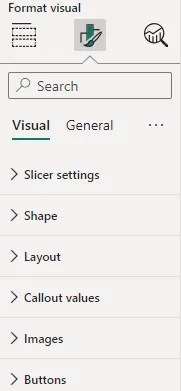
As with the new card visual, Microsoft continue to offer a wider range of formatting features for users to modify in the new button slicer.
At first glance formatting looks straightforward, but as ever, the devil is in the detail.
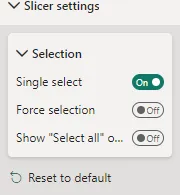
You can configure selection with three different options:
Single select is turned on by default and you can now force the slicer to have an option selected at all times.
There is no longer an option for multi-select as with the old tile slicer.
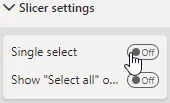
If you want to select multiple options, simply turn off the single select setting:
You can now select as many buttons as you want in your slicer...
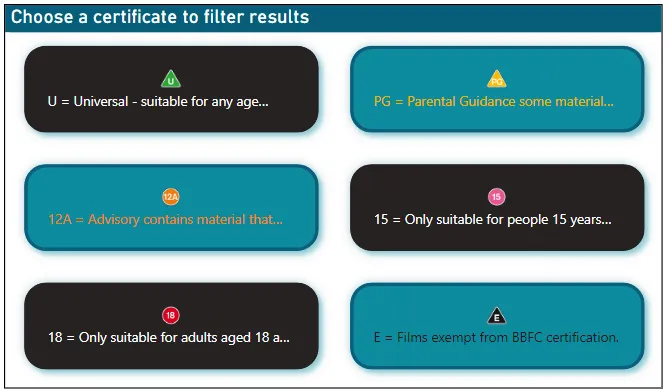
Here's what that would look like:
This slicer has three options selected.
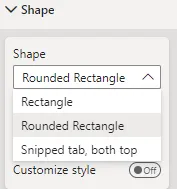
You can choose three different types of border:
These options are the same as those for the new card visual.
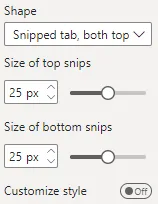
If you choose snipped tabs, you can control how much you want to snip by at the top and bottom:
See below for an example of these choices...
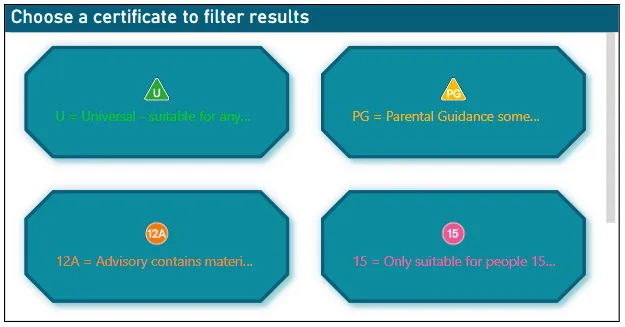
Here's what snipped tabs look like:
These have been snipped by 25% at the top and bottom.
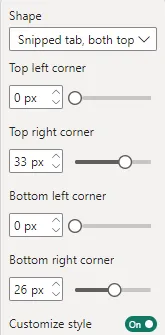
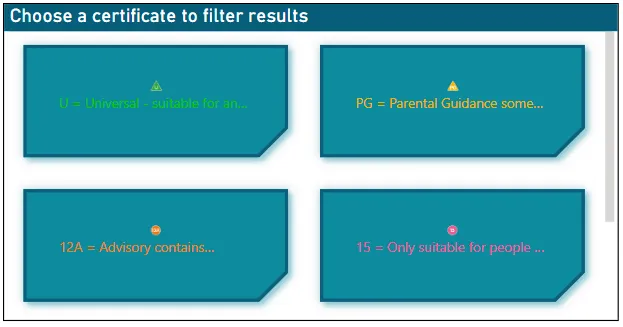
With both the snipped tab and rounded corner settings you can customise the percentage of snip (or rounding) on a corner by corner basis:
Switch on Customize style to set individual values for each corner.
Here's an example of individual snipped corners:
At the time of writing this blog the top right corner snip only worked if the top left corner was also snipped. When using the rounded rectangle option, this property worked as you'd expect it to.
This isn't the only formatting option that needs to be fixed!
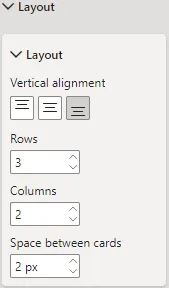
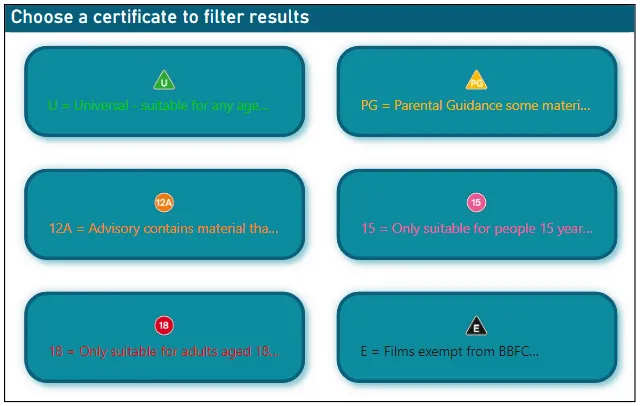
You can control how many columns and how many rows of buttons you want to display here:
The vertical alignment property affects the text in the image below...
Here's what the layout settings look like:
These buttons have been arranged into two columns with three rows in each.
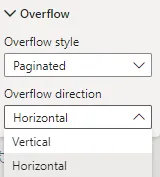
If your buttons overflow your slicer visual due to its size, you have two options for controlling the overflow:
Choose whether you want to scroll to your remaining buttons or display them on a separate page in the visual.
You can also choose whether the option to scroll or move to the next page of buttons is horizontal or vertical:
See below for how these choices affect the slicer.
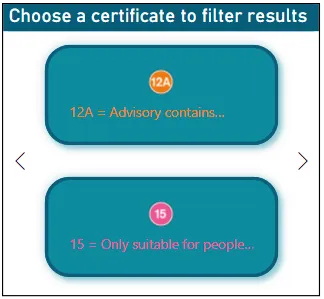
Here's what a button slicer with horizontal paginated overflow looks like:
You click on the chevrons to navigate to other pages of buttons.
Having set the layout and shape of your buttons, you can now set the border, fill colour, shadow, and glow settings for them - or for separate states that they might be found in:
A general principle of the new button slicer: you can apply formatting to different states the button is under.
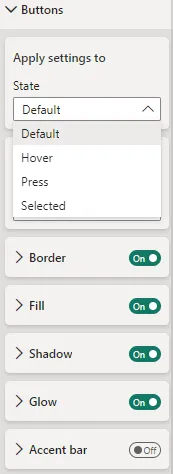
Here I've set the Border, Fill, Shadow and Glow settings for my buttons under the default state:
These can all be changed to give a different appearance when the button is hovered over, pressed or selected.
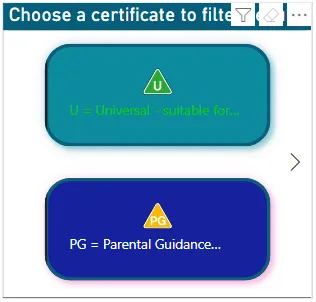
You can make it very clear that you are about to interact with a button:
The PG button is set to have a blue fill colour when the user hovers over it.
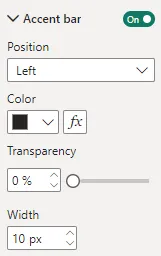
You can set something called an accent bar to make each button stand out more:
This accent bar is set to appear black, 10 pixels wide and on the left. It's also been set to work when the button is pressed.
Here is what it looks like:
The thick vertical bar to the left on the U button is the accent.
Many of these properties can be dynamic. You could set the fill colour of the buttons to be an expression based on a field or measure in your dataset.
Parts of this blog |
---|
|
Some other pages relevant to the above blogs include:
Kingsmoor House
Railway Street
GLOSSOP
SK13 2AA
Landmark Offices
99 Bishopsgate
LONDON
EC2M 3XD
Holiday Inn
25 Aytoun Street
MANCHESTER
M1 3AE
© Wise Owl Business Solutions Ltd 2025. All Rights Reserved.