To go along with the new visual calculations feature, Power BI has a range of new DAX functions. You can see a list of the new visual calculation functions covered in this part of the blog series in the table below:
Function name | What it does |
|---|
FIRST | Returns the first value of a visual axis. |
LAST | Returns the last value of a visual axis. |
MOVINGAVERAGE | Creates a rolling average on a visual axis. |
NEXT | Returns the value on the next row of a visual axis. |
PREVIOUS | Returns the value on the previous row of a visual axis. |
RUNNINGSUM | Creates a running total on a visual axis. |
Read on to understand why these functions are useful!
Creating Running Totals
You can use the RUNNINGSUM function to create a running total in a visual. Here's the basic syntax of the function (square brackets indicate that the parameter is optional):
RUNNINGSUM( Column, [Axis], [Blanks], [Reset] )
In the matrix below, we're showing the total box office grouped by year, quarter, month and day:
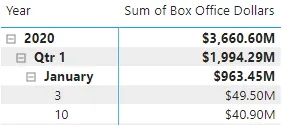
The matrix uses the automatic date hierarchy of the Release Date field.
Adding a running total for the Sum of Box Office Dollars column is simple enough:

The basic version of the RUNNINGSUM function requires a reference to a single column.
After creating the visual calculation, the matrix looks like this:
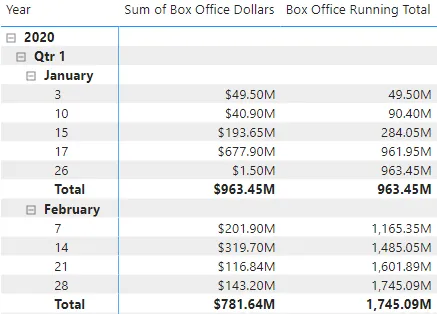
We've formatted the display units of the visual calculation and placed row subtotals at the bottom of each group.
Resetting a Running Total
By default, the RUNNINGSUM function continues accumulating until the last row of the visual data table. You can use the optional Reset parameter to restart the accumulation at the beginning of any group in the visual. You can indicate which level to reset the running total for using either a number or one of two constants as shown in the table below:
Constant | Equivalent number |
|---|
HIGHESTPARENT | 1 |
LOWESTPARENT | -1 |
The example below resets the running total each year:

We could have used the number 1 instead of the HIGHESTPARENT constant.
Note that although the Reset parameter is the fourth one, you don't have to enter multiple commas to skip to it. The RUNNINGSUM function happily adapts to the list of arguments you provide:

The RUNNINGSUM function's parameter list comes in three varieties - you can cycle through them in the tooltip.
After creating the new calculation, the matrix looks like this:
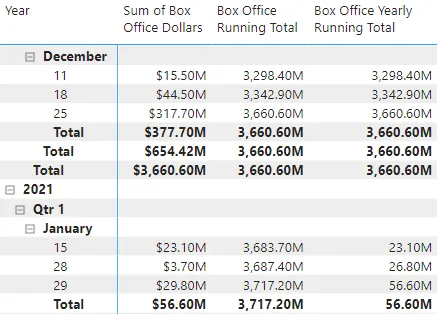
The running total resets at the beginning of the new year.
Changing the Axis of a Running Total
If you have a visual with both row and column groups, you can control which axis the running total is calculated over.

This matrix has both a row group (the year) and a column group (the quarter).
We can add a simple RUNNINGSUM calculation to the visual using this code:

This is the simplest form of the RUNNINGSUM function.
The matrix automatically calculates the running total over the rows of the visual, creating a new column for each quarter.
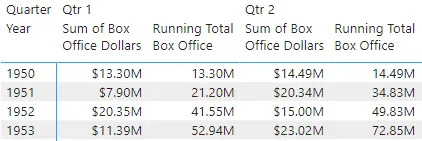
The running total works vertically down each column, accumulating row by row.
We can use the Axis parameter of the function to choose in which direction the running total should work. You can use one of four constants for the Axis parameter, as shown in the table below:
Constant |
|---|
COLUMNS |
COLUMNS ROWS |
ROWS |
ROWS COLUMNS |
We can use the COLUMNS constant to make our matrix calculate the running total horizontally across each row:

This will change the direction of the running total to work across the COLUMNS axis.
You can see the results in the diagram below:
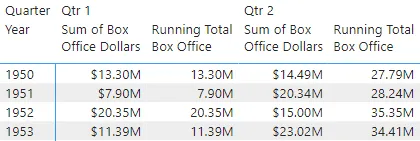
Now the running total works horizontally, accumulating column by column.
Calculating Moving Averages
You can use the MOVINGAVERAGE function to calculate moving averages easily. You can see the syntax of the function below (square brackets indicate the parameter is optional):
MOVINGAVERAGE( Column, WindowSize, [IncludeCurrent], [Axis], [Blanks], [Reset] )
The matrix below shows the Sum of Box Office Dollars for each year along with a three year moving average figure:
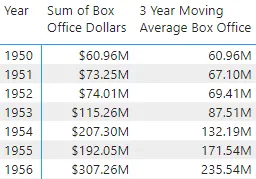
Each year shows the average of itself plus the preceding two years.
You can see the calculation which produces this result in the diagram below:

We've set the WindowSize parameter to include 3 rows in the average.
By default, the MOVINGAVERAGE function includes the current value in the average. You can exclude the current year from the average by changing the IncludeCurrent parameter:

Set the IncludeCurrent parameter to FALSE to exclude the current year.
You can see the results in the matrix below:
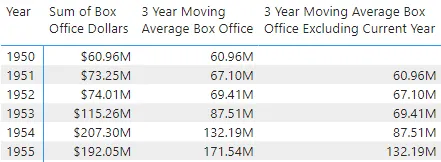
The new column excludes the current year from the average.
You can use the Axis and Reset parameters in the same way as for the RUNNINGSUM function.
Referring to Other Rows in a Visual
You can use several functions to refer to other rows in the same visual. You can see the syntax of these functions in the table below (square brackets indicate the parameter is optional):
Function | What it refers to (in case it wasn't obvious!) |
|---|
FIRST( Expression, [Axis], [Blanks], [Reset] ) | The value of the first row in the visual |
LAST( Expression, [Axis], [Blanks], [Reset] ) | The value of the last row in the visual |
NEXT( Expression, [Steps], [Axis], [Blanks], [Reset] ) | The value of the next row in the visual |
PREVIOUS( Expression, [Steps], [Axis], [Blanks], [Reset] ) | The value of the previous row in the visual |
In the matrix shown below we're comparing each year's total box office with the previous year.
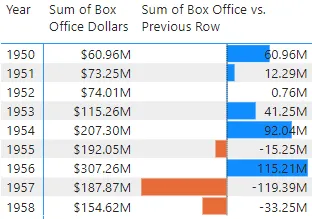
We've used conditional formatting to add data bars to make it easier to distinguish between the positive and negative values.
You can see the calculation we used to create this example in the diagram below:

We've used the PREVIOUS function to return the value from the previous row and subtracted this from the value of the current row.
The PREVIOUS and NEXT functions each have a Steps parameter which you can use to control how many rows forwards or backwards to move. The example below returns the value from three rows before the current row:
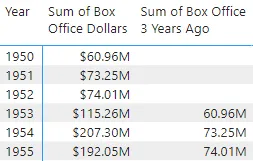
The first three rows have no value to display.
The formula to return these results is shown below:

The number 3 tells the PREVIOUS function to go three rows back to retrieve a value.
Still Not Convinced?
There's one other useful thing you can do with the new visual calculation functions. If you're still not convinced that visual calculations are useful, perhaps the final part of this blog series will change your mind!


