Read our blogs, tips and tutorials
Try our exercises or test your skills
Watch our tutorial videos or shorts
Take a self-paced course
Read our recent newsletters
License our courseware
Book expert consultancy
Buy our publications
Get help in using our site
538 attributed reviews in the last 3 years
Refreshingly small course sizes
Outstandingly good courseware
Whizzy online classrooms
Wise Owl trainers only (no freelancers)
Almost no cancellations
We have genuine integrity
We invoice after training
Review 30+ years of Wise Owl
View our top 100 clients
Search our website
We also send out useful tips in a monthly email newsletter ...
The Excel GROUPBY and PIVOTBY functions Part two of a two-part series of blogs |
---|
You may be familiar with using pivot tables in Excel to group and aggregate a list of data. Did you know that you can now do the same thing using simple functions? This blog shows you how to use the new GROUPBY and PIVOTBY functions to quickly summarise data.
|
In this blog
One limitation of the GROUPBY function is that you can only group by rows. The PIVOTBY function allows you to group by both rows and columns, essentially allowing you to produce an entire pivot table by writing a single formula! Here's the syntax of the function:
=PIVOTBY( row_fields, col_fields, values, function, [field_headers], [row_total_depth], [row_sort_order], [col_total_depth], [col_sort_order], [filter_array], [relative_to] )
Although it looks complicated, you should recognise many of the parameter names from the GROUPBY function - you already know most of what you need to know to use PIVOTBY!
Only the first four parameters of the PIVOTBY function are compulsory:
Parameter | What it means |
---|---|
row_fields | The values you want to group the rows by. |
col_fields | The values you want to group the columns by. |
values | The values you want to use in the calculation. |
function | The function you want to apply to the values. |
Here's a reminder of the movie data we're working with:
So much choice for grouping and aggregating!
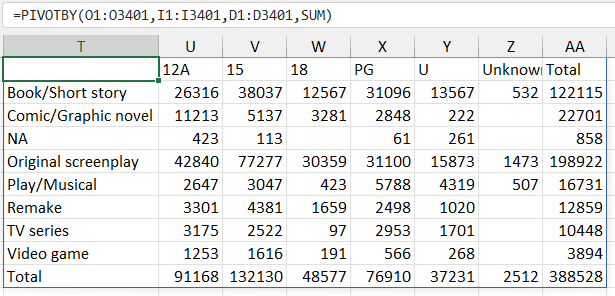
The example below groups the data by Source and Certificate, showing the Sum of Run Time Minutes for each group:
It couldn't be much simpler!
You can include field headers in the same way as for the GROUPBY function, although the results are a little messier this time:
The results are, arguably, more difficult to read now.
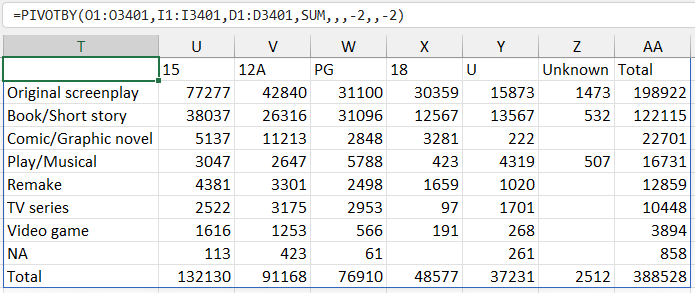
You can sort the rows and columns of the resulting table independently using the row_sort_order and col_sort_order parameters.
This sorts both the rows and columns in descending order of the sum of run time using the value -2.
You can include multiple calculation columns in the same way as for the GROUPBY function. The example below includes the average of the Budget Dollars and Box Office Dollars columns:
Each Certificate shows the average for two columns.
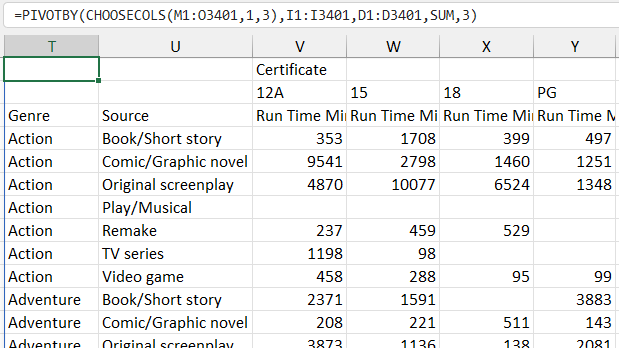
You can again use the CHOOSECOLS function to select non-adjacent columns:
This example picks columns 1 and 5 from the range D1:H3401.
You can also stack multiple different functions for a single value column:
We're using HSTACK to show both the SUM and AVERAGE of Run Time Minutes for each Certificate.
You can create multiple row groups in the same way as for the GROUPBY function.
We've grouped rows by Genre and Source.
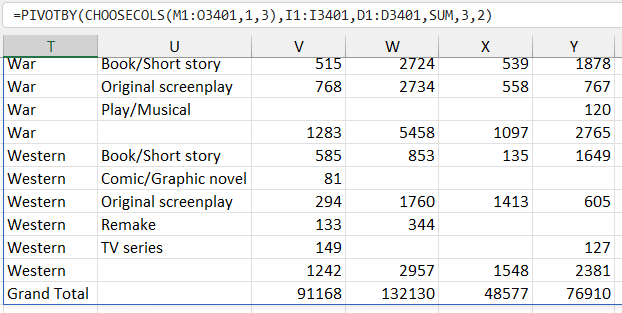
With multiple row groups, you can choose how to display totals and subtotals:
We're opting to show grand totals and subtotals for row groups.
You can see the results in the diagram below:
Each Genre group receives a subtotal and the grand total appears at the bottom of the table.
As you might expect, you can also apply multiple levels of grouping to the columns, as shown in the example below:
The columns are grouped by Source and Certificate.
You also have the option to display column totals and subtotals:
The options are the same as for row totals.
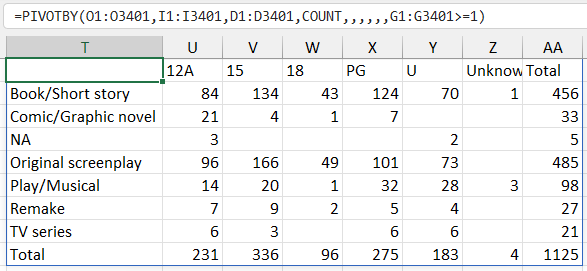
The filter_array parameter behaves in the same way as for the GROUPBY function:
This filter includes films which have at least 1 Oscar nomination.
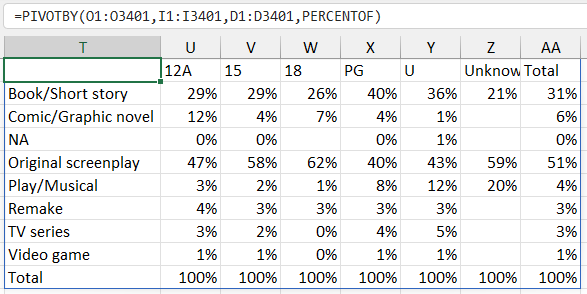
You can use the PERCENTOF function to show values as a percentage of a total:
We've added some formatting to make the results easier to read.
By default, the results are calculated as a percentage of the column total, but you can use the relative_to parameter to change this:
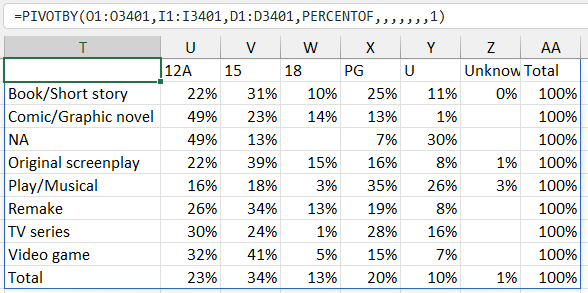
It takes a lot of commas to skip to the relative_to argument!
Here are the results of using the Row Totals option:
The values are shown as a percentage of the row total.
The GROUPBY and PIVOTBY functions provide a lot of power to group and aggregate large datasets incredibly quickly. While they don't replicate all the functionality of a full pivot table I think they're an excellent choice for getting quick answers and I'm looking forward to teaching these new functions in upcoming Excel courses!
Parts of this blog |
---|
|
Some other pages relevant to the above blogs include:
Kingsmoor House
Railway Street
GLOSSOP
SK13 2AA
Landmark Offices
99 Bishopsgate
LONDON
EC2M 3XD
Holiday Inn
25 Aytoun Street
MANCHESTER
M1 3AE
© Wise Owl Business Solutions Ltd 2024. All Rights Reserved.