Read our blogs, tips and tutorials
Try our exercises or test your skills
Watch our tutorial videos or shorts
Take a self-paced course
Read our recent newsletters
License our courseware
Book expert consultancy
Buy our publications
Get help in using our site
551 attributed reviews in the last 3 years
Refreshingly small course sizes
Outstandingly good courseware
Whizzy online classrooms
Wise Owl trainers only (no freelancers)
Almost no cancellations
We have genuine integrity
We invoice after training
Review 30+ years of Wise Owl
View our top 100 clients
Search our website
We also send out useful tips in a monthly email newsletter ...
Does the new Excel PIVOTBY function mean the death of pivot tables? |
---|
The new PIVOTBY function in Excel allows you to create a pivot table with a dynamic formula. Does this mean that the pivot table is redundant? |
In this blog
Is the pivot table redundant now that there's an Excel PIVOTBY function? This blog considers the advantages and disadvantages of each method of slicing and dicing data.
I haven't attempted to explain any of the syntax of the PIVOTBY function in this blog: for this see my colleague Andrew's excellent explanation of the syntax of the new Excel GROUPBY and PIVOTBY functions.
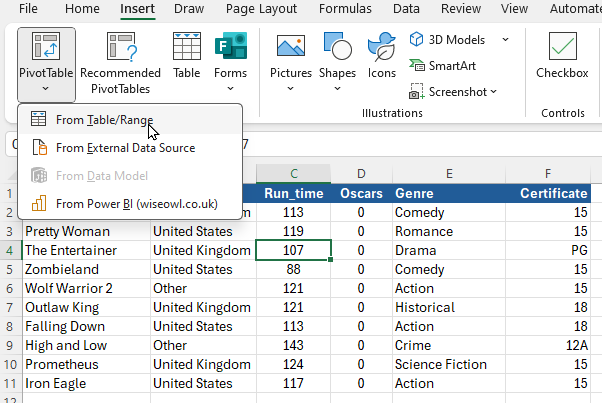
In Excel (and I'm hoping my readers know this!) you can create a pivot table to show data dynamically:
Creating a pivot table in old-style Excel.
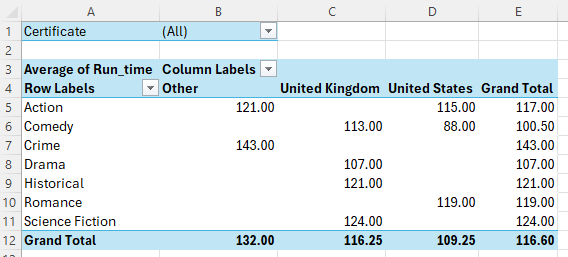
This creates something looking like this:
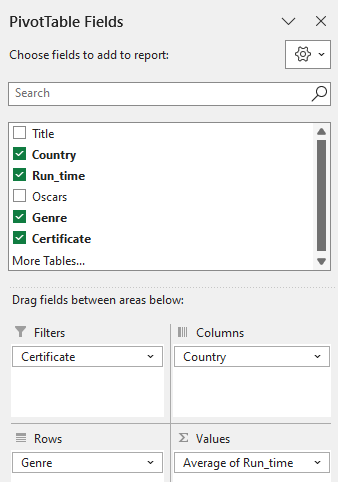
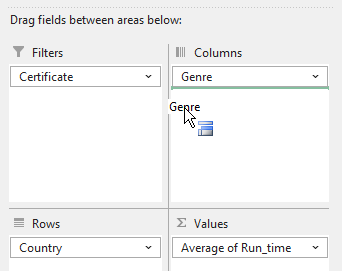
Here we're filtering by film certificate, grouping by genre, showing the countries in the columns and showing the average run time for each film as data.
Here's what these choices look like:
The choices corresponding to the pivot table shown above.
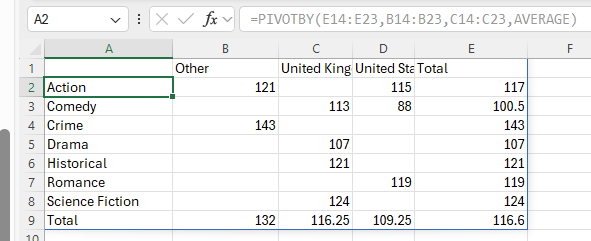
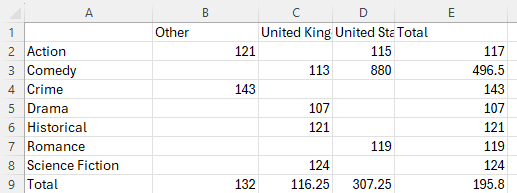
Here's the PIVOTBY version of this pivot table by contrast:
I haven't attempted any clever tricks (for that see my separate blog on creating dynamic pivot tables using the PIVOTBY function).
This uses a dynamic formula to fill as many cells as are needed.
It seems to me that the second method of pivoting data (using a function) has one big advantage - being a formula, it's dynamic. If you change one of the values in your underlying data:
Here we've switched to the (imaginary) director's cut of Zombieland, in which Bill Murray gets more than a cameo part, extending the length from 88 to 880 minutes ...
... then the data returned by the PIVOTBY function will automatically update:
... meaning that the average runtime for Comedy films has shot up (was Zombieland really a comedy?).
The other big advantage of using PIVOTBY to return pivoted data is that any other formula in your workbook can then reference this in a straightforward fashion (because the data is being returned by a normal formula its behaviour will be predictable).
There are two obvious advantages of the pivot table approach:
Advantage | Notes |
---|---|
Flexibility | It's easy to add grouping fields, or swap rows or columns round. |
Formatting | It's much easier to format the data returned by a pivot table. |
Let's look at an example of each of these. For flexibility, suppose that you want to swap the genre and country round in our example. For a pivot table you can just drag and drop:
Swapping fields around could hardly be easier!
For a PIVOTBY function formua, by contrast, you need to edit the function arguments manually.
In addition to the obvious formatting tools shown above, pivot tables also allow you to add slicers and timelines to provide additional ways of filtering data.
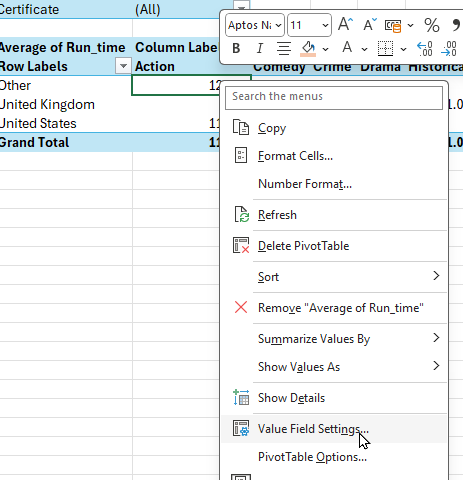
On the formatting front, pivot tables have a huge array of tools to make it easy to format them, including pivot table styles. Here's just one example:
If you want to change the number format of every cell, you can choose this option with a single cell selected. With a PIVOTBY function you would have to select all of the cells returned from the formula first.
If you are creating a pivot table to present at a board meeting, it makes sense to continue to do this manually (since you'll then have far more control over the structure and formatting of your pivoted data). If on the other hand you are only pivoting data so that you can get at (and perhaps further manipulate) the aggregated data, it may make sense to use the new PIVOTBY function instead.
Some other pages relevant to the above blog include:
Kingsmoor House
Railway Street
GLOSSOP
SK13 2AA
Landmark Offices
99 Bishopsgate
LONDON
EC2M 3XD
Holiday Inn
25 Aytoun Street
MANCHESTER
M1 3AE
© Wise Owl Business Solutions Ltd 2024. All Rights Reserved.