Read our blogs, tips and tutorials
Try our exercises or test your skills
Watch our tutorial videos or shorts
Take a self-paced course
Read our recent newsletters
License our courseware
Book expert consultancy
Buy our publications
Get help in using our site
551 attributed reviews in the last 3 years
Refreshingly small course sizes
Outstandingly good courseware
Whizzy online classrooms
Wise Owl trainers only (no freelancers)
Almost no cancellations
We have genuine integrity
We invoice after training
Review 30+ years of Wise Owl
View our top 100 clients
Search our website
We also send out useful tips in a monthly email newsletter ...
Power BI Desktop - Updates for October 2024 Part two of a five-part series of blogs |
---|
You can now create data-bound reference layers in Azure maps, document your model's measures, tables and columns using the INFO.VIEW function in DAX, format chart markers within inches of their lives and apply dynamic formatting using DAX.
We've been creating our idiosyncratic monthly blogs on Power BI updates since November 2016, and also deliver online and classroom Power BI courses. |
In this blog
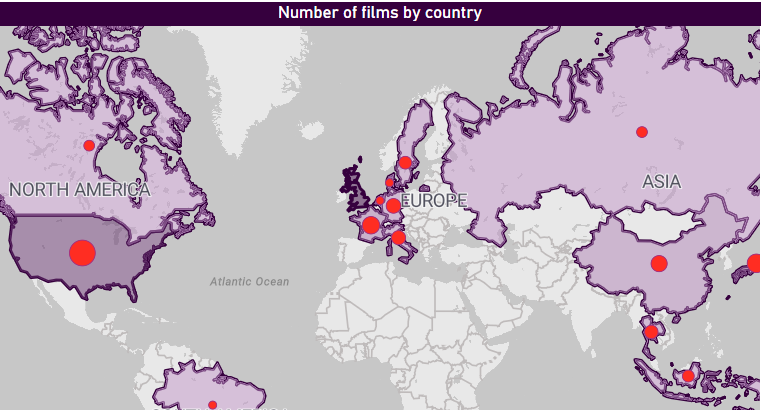
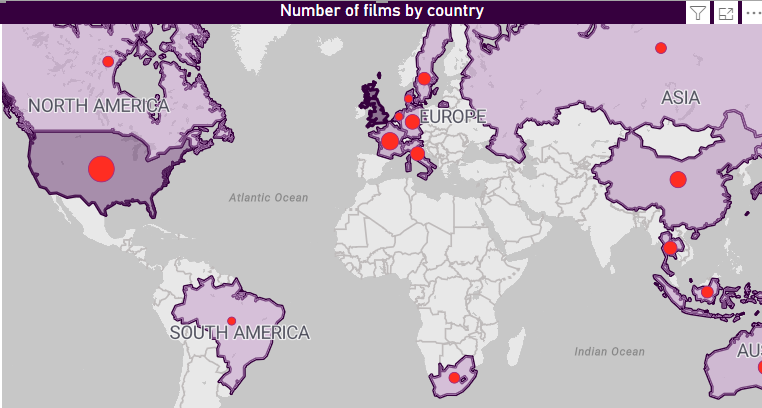
Shape maps have just got easier: you can format reference layers in Azure map visuals based on the data you are displaying.
This map is showing the number of films made by country in a dataset - the darker the country's shading, the more films it made.
Here's how to get data-driven reference layers like this working!
A warning: it seems that if you publish Azure reports containing maps using conditional formatting like this, when you switch tabs the conditional formating disappears (thanks Lisa). I'll try to remember to remove this hint when this bug is solved, but can't guarantee to do so!
This is always the hardest thing to do with any map. I got mine from OpenDataSoft:
I chose this format, but Power BI supports others, as shown later in this blog.
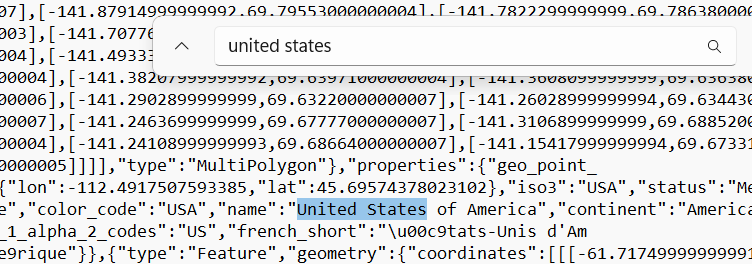
Having downloaded a suitable map definition file, you should inspect it:
There are many better ways to read JSON files in programmatically - I'd probably choose Python - but I just want to illustrate the point.
See what the regions you're using for your shapes are called:
This shows that you'll need to refer to the USA as United States of America, since that's what the name field uses.
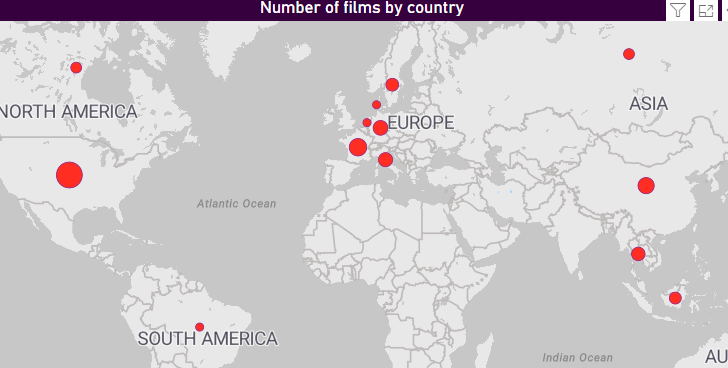
The next thing you'll need to do is to create a map:
An Azure map showing the number of films in our dataset for each country in the world.
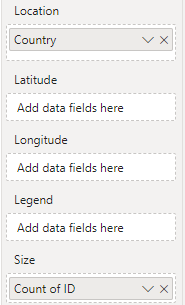
Here are the data this map is displaying:
We're showing the number of rows (counting the unique id field for each film) by country.
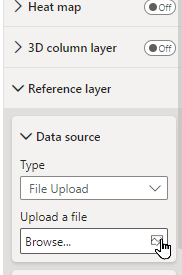
You should now choose to use the file you downloaded earlier as your reference layer:
Click on this button to upload your file of shape data.
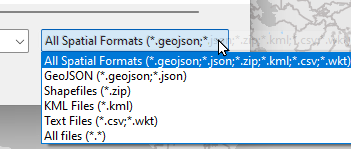
You can choose a few different formats:
We're going to choose our .geojson file.
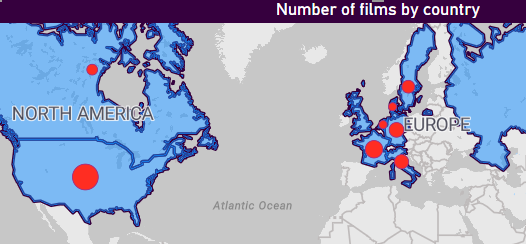
You should now have a reference layer!
The countries are all showing in the same colours for now.
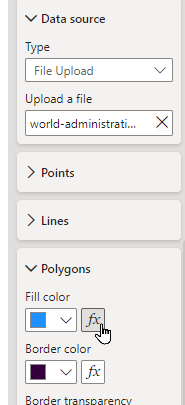
You can now make the colour of each polygon depend on the data displayed within it:
Click on the fx button to the right of the fill colour (you can also make the border colour vary according to the data being displayed).
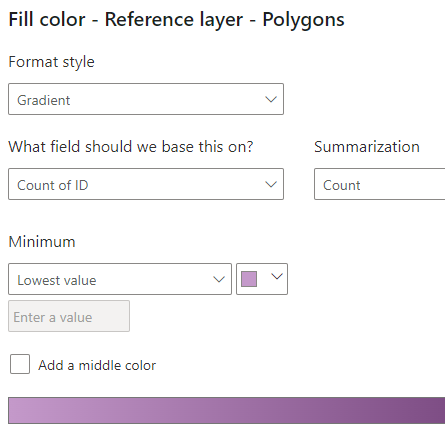
Set your conditional formatting;
This is the standard conditional formatting box for gradient fill - here we're setting a pale purple colour for the minimum number of films for any country, and (not shown above) a dark purple for the maximum number of films for any country, which will presumably be the United States.
This should give your shape map:
As expected the United States has the darkest colour.
If any country which you would expect to be coloured isn't, it's probably because of a mismatch between the region name in your dataset and the name field in the JSON file you've uploaded. In my case I had to replace United States with United States of America, Russia with Russian Federation and a few other changes besides.
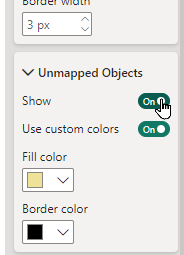
Most of the countries in the map above are shown in white, because our dataset doesn't contain any films made in them. You can change the formatting of these unmapped objects:
Here I've chosen to show these "unused" countries in yellow(ish).
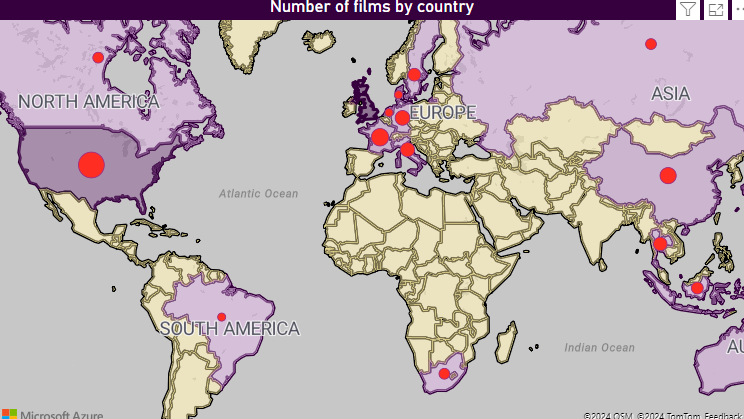
Here's what this would then give:
Perhaps we should have changed the border too?
And that's our shape map!
This is all great, but it does beg the question: for how much longer will Microsoft continue to show the Shape map visual as being in preview? It's been there for years - time now perhaps to admit that it will never see the light of day, as it's no longer needed!
Parts of this blog |
---|
|
Some other pages relevant to the above blogs include:
Kingsmoor House
Railway Street
GLOSSOP
SK13 2AA
Landmark Offices
99 Bishopsgate
LONDON
EC2M 3XD
Holiday Inn
25 Aytoun Street
MANCHESTER
M1 3AE
© Wise Owl Business Solutions Ltd 2024. All Rights Reserved.