It sounds useful, doesn't it? Being able to step through your queries line by line to see where any error occurs? This tutorial will show how to debug in copious detail, but be warned ...
Debugging SQL is nowhere near as useful as debugging a VB or C# program, since each INSERT, DELETE, UPDATE or SELECT statement can not be broken down into smaller parts.
Our Example Query
The following modest query will call a stored procedure to add 5 types of owl into a table, then display the results:
BEGIN TRY
DROP TABLE tblOwl
PRINT 'Deleted table'
END TRY
BEGIN CATCH
PRINT 'No table to delete'
END CATCH
EXECUTE spCreateOwlsTable
DECLARE @num int
SET @num = ( SELECT COUNT(*) FROM tblOwl )
SELECT
'Added ' +
CAST(@num AS varchar(10)) +
' owls'
SELECT
OwlId,
OwlName
FROM
tblOwl
ORDER BY
OwlName
The above SQL calls the following stored procedure (I've put this in so I can show the difference betweeen stepping into and stepping over commands):
CREATE PROC spCreateOwlsTable
AS
CREATE TABLE tblOwl (
OwlId int PRIMARY KEY IDENTITY(1,1),
OwlName varchar(50)
)
INSERT INTO tblOwl(OwlName) VALUES ('Tawny')
INSERT INTO tblOwl(OwlName) VALUES ('Barn')
INSERT INTO tblOwl(OwlName) VALUES ('African fish')
INSERT INTO tblOwl(OwlName) VALUES ('Long-eared')
INSERT INTO tblOwl(OwlName) VALUES ('Wise')
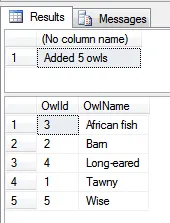
Running the first query should give the following output:

The query shows the number of owls added, then lists them in a table.
So much for our example - time to begin debugging!
This blog assumes that you're using SQL Server 2008 R2 or SQL Server 2012 - the rules are different for earlier versions of SQL. The blog also assumes that you're connected to a database on the same computer. If this isn't the case, you may need to configure the debugger - here are separate articles showing how to do this for SQL Server 2012 and SQL Server 2008 R2.
Assuming that you've read the first part of this blog, you're now ready to debug your query!
Starting the Debugger
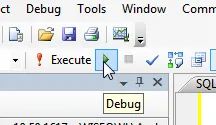
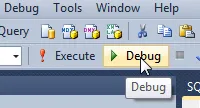
There are lots of ways to start debugging! Assuming that you have a query window open, you can use the Management Studio toolbar:
 |  |
SQL Server 2008 R2 | SQL Server 2012 |
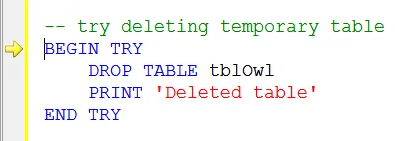
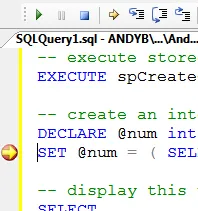
Alternatively, you can press Alt + F5 in either application. Whichever method you choose, SSMS will mark with a yellow arrow the line of SQL that it is about to execute:

SQL is about to execute the statement marked with an arrow.
Stepping through your SQL
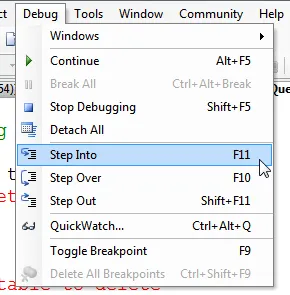
To execute a line of SQL you have two choices - you can step into a procedure, or step over it:

The menu shown is for SQL Server 2008 R2 - the 2012 one is almost identical.
As the menu above shows, you can press F11 to step into a procedure, or F10 to step over it. For most lines of code, there won't be any difference:

It won't matter whether you step into this statement or step over it.
However, when you're calling a stored procedure or user-defined function, there is a big difference:

It makes a big difference whether you step into or over this call.
Here's what will happen for the above line:
Option chosen | What will happen |
|---|
Step over | SQL will run the stored procedure in its entirety, and leave the yellow arrow pointing to the next line of code in the main query. |
Step into | SQL will open the stored procedure in a new window, and leave the yellow arrow pointing to the first line of code in it. |
The moral? If you're happy that your stored procedure isn't the source of your problems, step over it; otherwise, step into it. If you change your mind, you can always press SHIFT + F11 to finish a stored procedure and return control to the calling query!
Changing the next statement executed
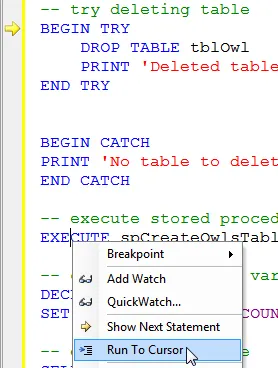
You can choose to run a query up to the current cursor position:

Right-click on a statement while debugging to execute a query up to (but not including) the statement.
Normally you can click and drag on the yellow arrow to change the next statement to execute, but in Management Studio this doesn't seem to work. Perhaps just as well - as the tooltip says (with terrifying understatement) that "this can have unintended consequences".
Stopping Debugging
When your query finishes, so will your debugging. If you want to end debugging early, however, you can click on the tool below to stop debugging:

Click on this tool to cancel debugging.
You can also press SHIFT + F5 to do the same thing.
Now we've looked at basic debugging, it's time to look at some of the tools you can use, starting with setting breakpoints.
Breakpoints provide a great way to run a query normally until you reach a given statement, and then debug from this point onwards.
Setting and Removing Breakpoints
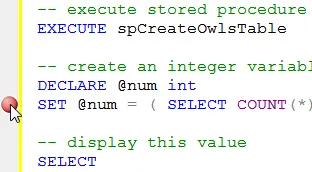
You can set any statement to be a breakpoint by clicking in the left (grey) margin:

Click in the grey margin to set a breakpoint for any statement (a red circle will appear).
Breakpoints for long SQL statements can be a bit misleading:

It looks like we've set a breakpoint for part of this statement, but in fact this isn't possible!
To remove a breakpoint, just click again (you can also press F9 to toggle breakpoints on and off). When you run a query it will stop at any breakpoint:
 |  |
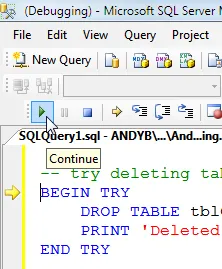
Continue debugging ... | ... and execution stops here. |
Note that breakpoints only work when you're already debugging a query (if you execute a query normally, breakpoints will be ignored).
Disabling breakpoints
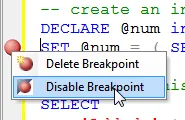
If you disable a breakpoint, it makes it easier to reactivate it in the future:
 |  |
Right-click on the red circle ... | ... to disable a breakpoint. |
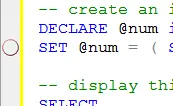
A disabled breakpoint shows up as an empty circle: you can reinstate a disabled breakpoint by right-clicking again.
Listing and managing breakpoints using the breakpoints window
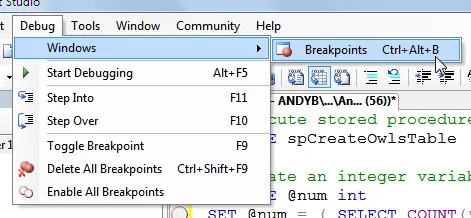
I've never used this window in my SQL career, but I'm feeling in a do-the-thing-properly mood. You can display the breakpoints window as follows:

Choose this menu option to display the breakpoints window.
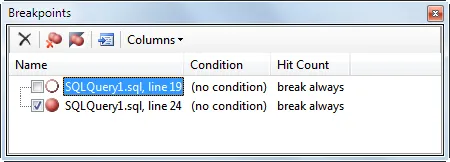
The window displays more information than you could ever want!

Here we have two breakpoints, one of which is currently disabled. For SQL the Condition and Hit Count columns will always contain the same values. You can click on the Columns dropdown to fine-tune which columns of information are displayed.
Removing all of your breakpoints
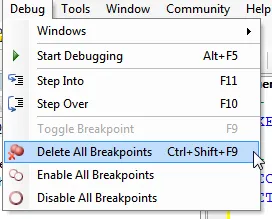
Breakpoint build up, and it's a pain having to remove each one individually, so I often use this menu option:

Choose this menu option to remove all of your breakpoints in one go.
For the final part of this blog I'll take a look at some of the other debugging tools available for SQL Server Management Studio, including how to monitor the values of variables that you've created using the Locals window.
This page shows some of the other tools available in the Management Studio debugger.
The Locals window
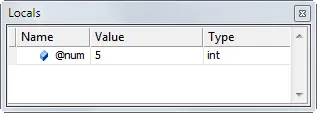
The Locals window displays the value of any variable that you're currently using:

Here the integer variable @num currently holds the value 5.
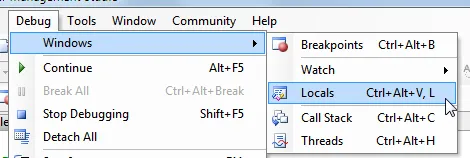
You can display the Locals window using the following menu option:

Note that this menu is only available when you are in the middle of debugging a query.
Other debugging tools
If you're experienced at debugging, you may well have used other Visual Studio tools. Confusingly, these can also appear in SQL Server Management Studio even though they aren't actually useful.
This is because Management Studio is now written as part of Visual Studio, which has a far wider range of built-in debugging tools.
For those in the know, here are some of the debugging tools you probably won't want to bother using in Management Studio:
Tool | Notes |
|---|
Watch window | Yes, yoiu can watch variables, but this doesn't offer any additional features over and above those provided by the Locals window. |
Immediate and Command windows | Although these can appear in Management Studio, they're not actually usable! |
The call stack | It's rare that you'll ever have the need to use this, since having stored procedures calling stored procedures calling stored procedures is not that common a scenario.! |
And with that damp squib, I (and you) have reached the end of this tutorial on debugging T-SQL queries!


