Read our blogs, tips and tutorials
Try our exercises or test your skills
Watch our tutorial videos or shorts
Take a self-paced course
Read our recent newsletters
License our courseware
Book expert consultancy
Buy our publications
Get help in using our site
542 attributed reviews in the last 3 years
Refreshingly small course sizes
Outstandingly good courseware
Whizzy online classrooms
Wise Owl trainers only (no freelancers)
Almost no cancellations
We have genuine integrity
We invoice after training
Review 30+ years of Wise Owl
View our top 100 clients
Search our website
We also send out useful tips in a monthly email newsletter ...
Posted by Andrew Gould on 17 November 2016
This video helps you to get started with charts in Excel VBA. You'll learn how to create a new chart sheet and set the chart's data source using a variety of techniques, including how to dynamically set the data source based on conditions. You'll also see lots of ways to change the appearance of the chart, including using chart layouts, chart colour schemes, chart styles and even how to create your own custom chart template.
See our full range of VBA training resources, or test your knowledge of VBA with one of our VBA skills assessment tests.
This video has the following accompanying files:
File name | Type | Description |
---|---|---|
Excel VBA - Introduction to Charts in VBA.xlsm | Excel workbook with macros |
Click to download a zipped copy of the above files.
There are no exercises for this video.
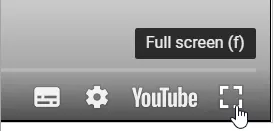
You can increase the size of your video to make it fill the screen like this:
Play your video (the icons shown won't appear until you do), then click on the full screen icon which appears as shown above.
When you've finished viewing a video in full screen mode, just press the Esc key to return to normal view.
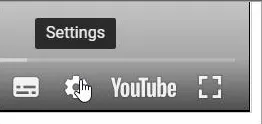
To improve the quality of a video, first click on the Settings icon:
Make sure yoiu're playing your video so that the icons shown above appear, then click on this gear icon.
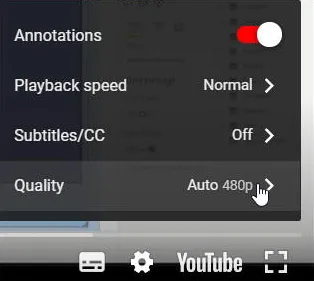
Choose to change the video quality:
Click as above to change your video quality.
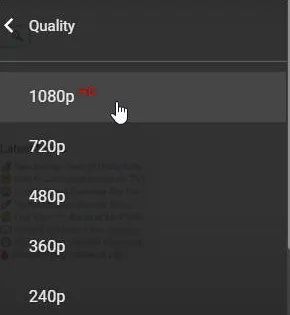
The higher the number you choose, the better will be your video quality (but the slower the connection speed):
Don't choose the HD option shown unless your connection speed is fast enough to support it!
Is your Wise Owl speaking too slowly (or too quickly)? You can also use the Settings menu above to change your playback speed.
From: | duggie |
When: | 06 Mar 24 at 15:14 |
A couple of points:
The suggestion you provided for setting the source of a map works but only if the map was embedded on a worksheet. If the map was "on its own" ie on a chartsheet, it fails.
Is there a workaround for this?
I use the following code to change the size of the legend and it works for a column / bar, etc chart:
ActiveSheet.ChartObjects("Chart 1").chart.legend.width=10
but if the chart is a map, I get an error:
Object doesn't support this action.
Is there a fix for maps to alter the size of the legend?
or have i identifed two further bugs with Excel?
From: | Andrew G |
When: | 06 Mar 24 at 18:26 |
Hi!
I don't know! You could try changing the location to make it an embedded chart, change the datasource and change it back to a separate chart sheet.
I don't know! It's probably another bug.
From: | duggie |
When: | 21 Feb 24 at 23:23 |
I have two columns of data, country and metric and I created a column chart from it manually.
This code sets the source data of a chart:
ActiveSheet.ChartObjects("Chart 1").Activate
ActiveChart.SetSourceData Source:=Range("Sheet1!$A$1:$B$3")
However, when I changed the chart type manually to a map, then ran the code, I got an error:
run-time error 445 Object doesn't support this action
Are maps different to "normal" charts? How can I set its source data?
From: | Andrew G |
When: | 22 Feb 24 at 09:38 |
Hi!
It looks like the easiest way is to select the cells before creating the map.
Range("A1:B5").Select
ActiveSheet.Shapes.AddChart2 XlChartType:=xlRegionMap
I hope it helps!
From: | duggie |
When: | 22 Feb 24 at 11:40 |
Thanks but if a map chart has already been created, does that mean you would need to delete it, then select the revised range before creating it?
Is it not possible to amend the source data range directly?
From: | Andrew G |
When: | 28 Feb 24 at 07:11 |
:D that sounds like a great idea but would be a lifetime's work!
From: | duggie |
When: | 27 Feb 24 at 17:45 |
A bug in Excel? Never!
I've encountered a fair number of these and I'm sure you have too.
Have you ever considered compiling a list, along with some explanations and workarounds, then possbily creating a book / document out of it? Think it'll be a first.
From: | Andrew G |
When: | 22 Feb 24 at 13:11 |
It seems so, yes. There appears to be a bug with map charts and the SetSourceData method.
Kingsmoor House
Railway Street
GLOSSOP
SK13 2AA
Landmark Offices
99 Bishopsgate
LONDON
EC2M 3XD
Holiday Inn
25 Aytoun Street
MANCHESTER
M1 3AE
© Wise Owl Business Solutions Ltd 2025. All Rights Reserved.