Read our blogs, tips and tutorials
Try our exercises or test your skills
Watch our tutorial videos or shorts
Take a self-paced course
Read our recent newsletters
License our courseware
Book expert consultancy
Buy our publications
Get help in using our site
551 attributed reviews in the last 3 years
Refreshingly small course sizes
Outstandingly good courseware
Whizzy online classrooms
Wise Owl trainers only (no freelancers)
Almost no cancellations
We have genuine integrity
We invoice after training
Review 30+ years of Wise Owl
View our top 100 clients
Search our website
We also send out useful tips in a monthly email newsletter ...
New features in the Power BI November 2022 update Part five of a five-part series of blogs |
---|
This update includes the roll-out of field parameters, separate Y axes for small multiples and new DAX debugging functions - and a new colour for Power BI!
We've been creating our idiosyncratic monthly blogs on Power BI updates since November 2016, and also deliver online and classroom Power BI courses. |
In this blog
Here's how this update begins on the Microsoft site:
The answer to this is an enthusiastic and resounding ... YES!
So how does this work in practice? Time to find out!
A quick management summary: it works well, IF you're prepared to download a third-party utility which is still in preview or to invest time in learning how to use SQL Profiler to show debug output.
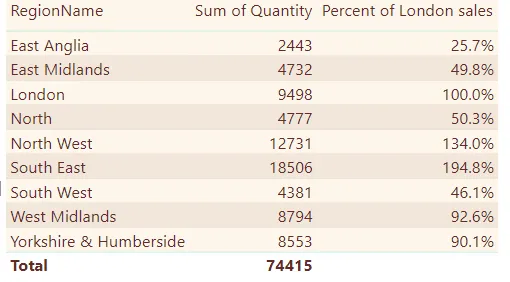
I'll use for this blog an example measure to show total sales divided by the figure for the London region:
The measure should display 100% for London - and does!
Here is the measure in question:
Percent of London sales =
// calculate sales as % of London
IF(
HASONEVALUE(Region[RegionName]),
DIVIDE(
SUM(Purchase[Quantity]),
// London sales
CALCULATE(
SUM(Purchase[Quantity]),
Region[RegionName] = "London"
)
),
BLANK()
)
There are 3 new functions for writing debug output:
Function | What it writes to | Additional arguments |
---|---|---|
EVALUATEANDLOG | The DAX evaluation log | A label to use to identify when the function was called |
TOCCSV | A CSV file | The delimiter to use, and whether to include headers (true by default) |
TOJSON | A JSON text string | None |
All of the functions make available an argument called MaxRows, which limits how many rows will be output each time that the function is called - this defaults to 10 rows for each function.
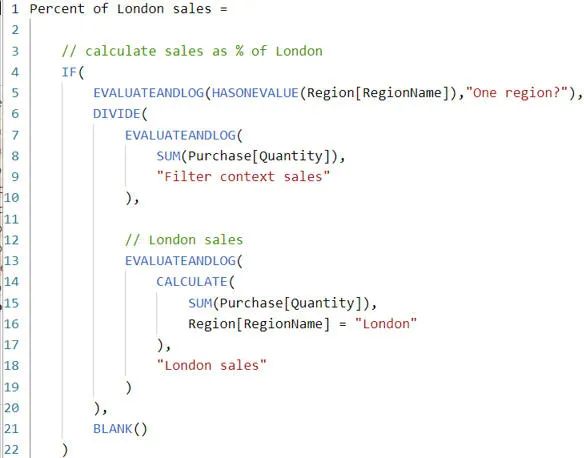
For our example measure above, we could add a few calls to the EVALUATEANDLOG function:
This measure will return exactly the same output, but will write out debug information also. You should remember to remove the calls to EVALUATEANDLOG when you've finished, otherwise they will slow down your reports.
On their website Microsoft link to this tool, but add that it is "not an official Microsoft tool and hence is not signed or supported".
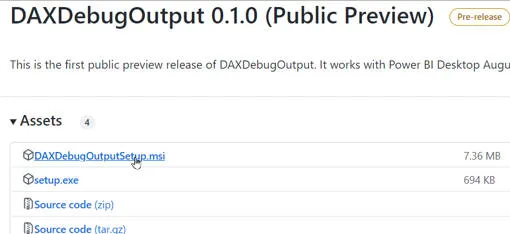
The GitHub download site doesn't inspire confidence, with words like Preview and Pre-release.
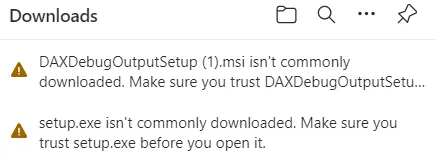
When you download either of the set-up files in Edge, you get this warning:
Definitely getting cold feet about this!
Initially I thought there was no way I would download this, and set about learning how to show debug output in SQL Profiler instead, which is the other way Microsoft recommend to show debug output from Power BI. However I then ran into these problems with SQL Profiler:
Problem | Notes |
---|---|
It's deprecated | Microsoft's own SQL Server website says that you should not use this for development as it is deprecated and will at some stage be discontinued. |
It's hard to learn | Confession: I got halfway through writing a blog on how to find your Power BI port number and use this to connect to your query log, and then decided to give up and return to the utility shown above (and below). |
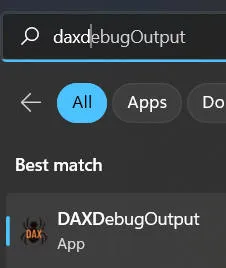
Chastened, I relented ... and downloaded DAXDebugOutput:
Tip - when you're searching for the application to run, it's one word.
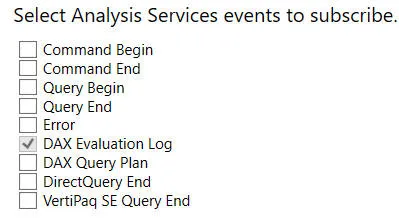
You can then choose which events you're going to monitor:
Choose which events you want to listen for.
I chose just the DAX evaluation log:
I chose to listen for this event only.
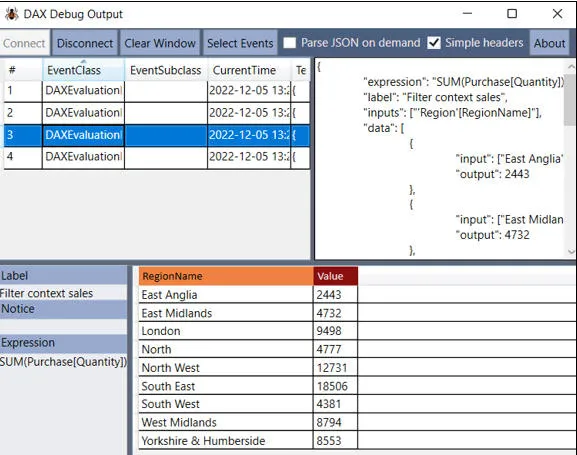
It's been a long learning curve, but when you do get this working ... it's worth it!
For the first time you can write debug from Power BI measures!
It is surely a matter of time before Microsoft find a way to show this output within Power BI itself. Isn't it?
Parts of this blog |
---|
|
Some other pages relevant to the above blogs include:
Kingsmoor House
Railway Street
GLOSSOP
SK13 2AA
Landmark Offices
99 Bishopsgate
LONDON
EC2M 3XD
Holiday Inn
25 Aytoun Street
MANCHESTER
M1 3AE
© Wise Owl Business Solutions Ltd 2024. All Rights Reserved.