Read our blogs, tips and tutorials
Try our exercises or test your skills
Watch our tutorial videos or shorts
Take a self-paced course
Read our recent newsletters
License our courseware
Book expert consultancy
Buy our publications
Get help in using our site
547 attributed reviews in the last 3 years
Refreshingly small course sizes
Outstandingly good courseware
Whizzy online classrooms
Wise Owl trainers only (no freelancers)
Almost no cancellations
We have genuine integrity
We invoice after training
Review 30+ years of Wise Owl
View our top 100 clients
Search our website
We also send out useful tips in a monthly email newsletter ...
A deep-dive into creating and using Azure Map visuals in Power BI Part three of a four-part series of blogs |
---|
The Azure map visual has been an official part of Power BI now for nearly a year, and the initial teething problems have now been ironed out. This blog shows how to use the Azure maps visual, and explains why you don't now need to use any of the other map visuals in Power BI.
|
In this blog
This blog page shows the many ways in which you can format Azure map visuals, and also some general tricks for working with them.
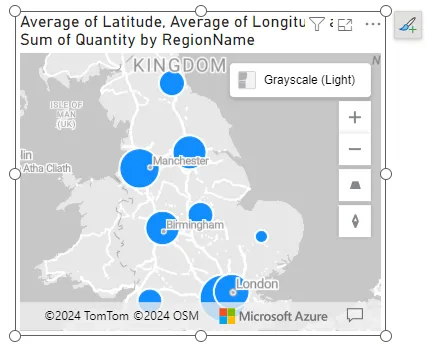
The first thing to remember is that a map is just another visual, so you can apply all of the standard formatting techniques:
A basic map, with no formatting applied.
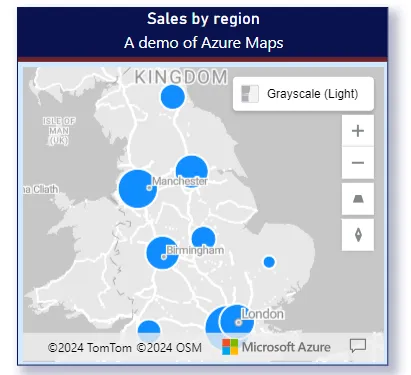
For example, by adding a title, subtitle, dividing line, border, background colour and shadow effect you could change the above map to look like this:
Exactly the same map!
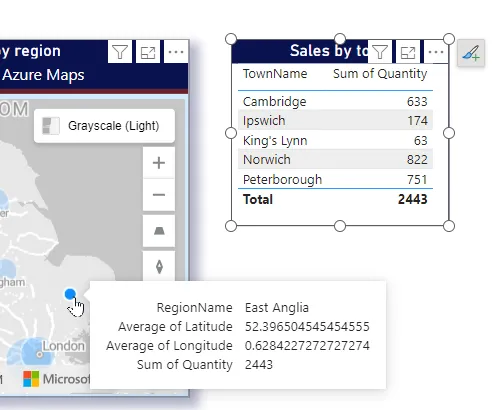
It's probably obvious, but when you select a data point in a map other visuals on the same page will (unless you've specified otherwise) reflect this change:
Selecting the East Anglia bubble filters the table to show just towns in East Anglia.
If you want you can give users of your report the opportunity to select multiple points in one go:
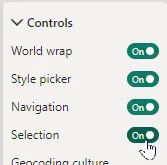
You'll need to enable the Selection control first.
You can then click on the selection tool:
Clicking on the selection tool gives you 4 different ways to select points: Circle, Rectangle, Polygon or Range.
Here's what the first 3 might let you do:
Tool | Example | What it would select |
---|---|---|
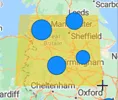
Circle | Two points (the one on the right is more than 50% included in the circle). | |
Rectangle | Four points (notice that the rectangle isn’t a true rectangle because of the curvature of the earth!). | |
Polygon | Two points (double-click to finish the polygon), but see the hint below. |
The polygon tool only seems to correctly select points when you view a report in Power BI Service (for desktop reports when you double-click to finish a polygon nothing happens).
Instead of these 3 tools, you could choose Range to see how far you'd get if the 60-minute warning sounded:
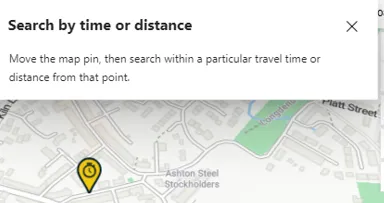
The first thing to do is say where the centre of your Universe should be.
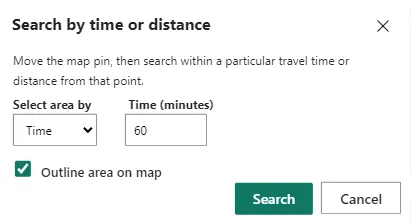
You can then specify your range (either in time or distance):
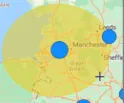
Here we'll show everything within a one hour drive of the Wise Owl head office.
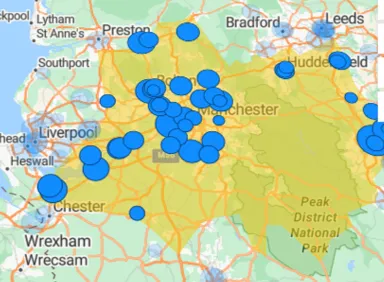
Power BI will then select all data points lying within this area:
I'm not convinced you could make it this far in one hour, given the local traffic, but it's an impressive feature.
One of the most annoying things about Azure maps is that they continually zoom back out again, but it's easy enough to change this:
The example below automatically zooms in to the Trafford Centre near Manchester, with zoom setting 11 (see below for more on what this means).
Here are the settings to change:
Crucially, this turns the irritating Auto zoom setting off, and also takes us to a zoom leve of 11, looking at an angle of 30 degrees and centred on the Trafford Centre's coordinates.
Fun fact: the zoom settings go from 0 to 24. Power BI divides the world into (2 to the power of n) tiles, where n is the zoom setting (so for 0 you just get one tile showing the entire world, for 1 you get 2 squared = 4 tiles, for 2 you get 2 cubed = 8 tiles, etc).
You can conditionally format map points, in the same way as for any other visual:
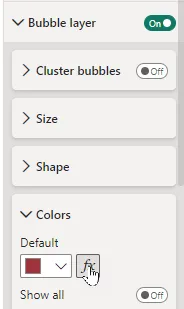
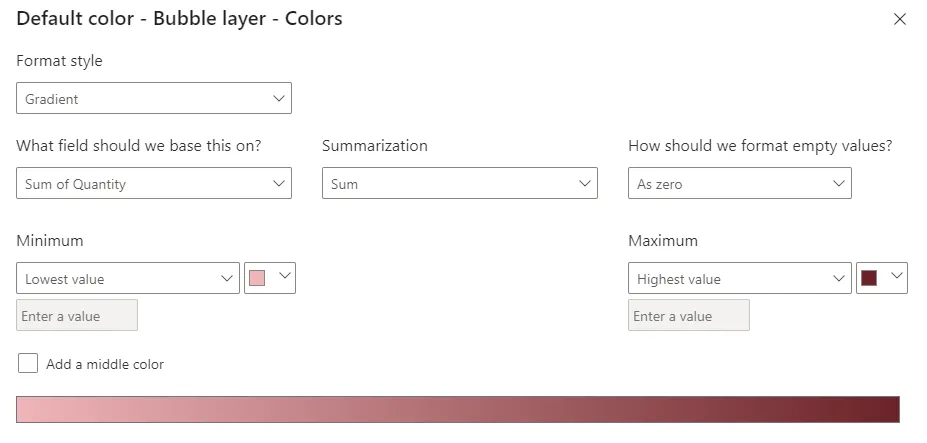
Choose to show the colours of the bubble layer of your map (assuming you have a default map) and click on the fx icon.
Set (for example) a gradient effect based on the volume of goods sold:
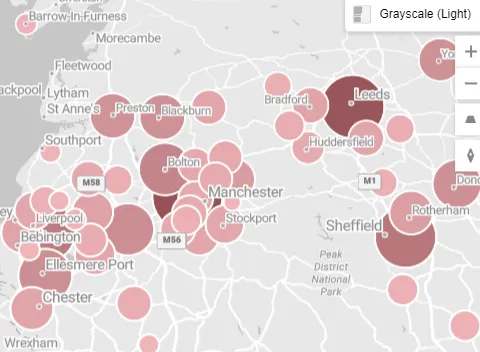
The more sales there are in a town, the darker its bubble will be.
This will give something like this:
Leeds and Manchester dominate. Shame there's no decent rail service between them ...
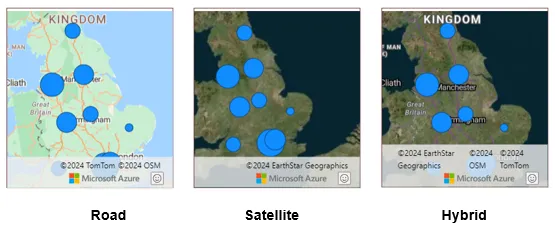
You can choose from a number of different backgrounds:
Three sample backgrounds.
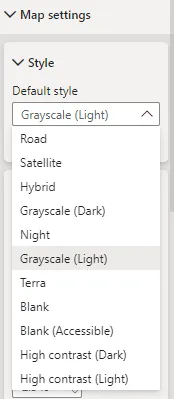
Here's how you change the map background:
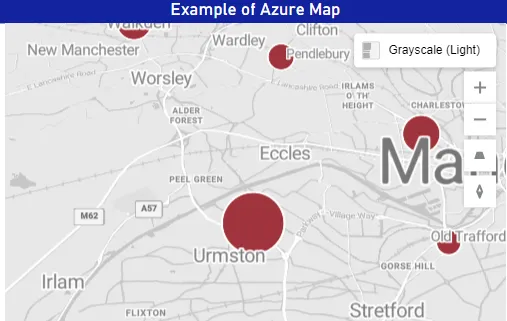
Most of the maps in this blog use the Grayscale (Light) background.
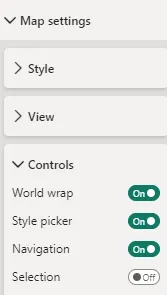
You can choose which symbols you want to display on a map:
How to choose which controls to display.
Here are the possibilities:
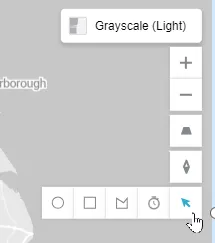
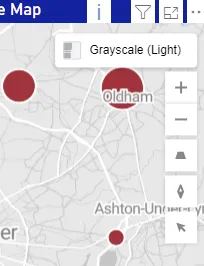
See below for what these symbols mean.
From top top bottom here's what the symbols mean:
Symbol | What it means |
---|---|
Allows you to zoom in and out. | |
Changes the angle of the pitch of view for the map. | |
Rotates the map. | |
Enables point selection (as shown previously in this blog). |
What this all shows is that Microsoft have taken the best bits from ArcGIS maps and MapBox visuals and combined them - it all works very well!
Parts of this blog |
---|
|
Some other pages relevant to the above blogs include:
Kingsmoor House
Railway Street
GLOSSOP
SK13 2AA
Landmark Offices
99 Bishopsgate
LONDON
EC2M 3XD
Holiday Inn
25 Aytoun Street
MANCHESTER
M1 3AE
© Wise Owl Business Solutions Ltd 2024. All Rights Reserved.