In a visual calculation you can change the level of the visual's hierarchy at which the formula is evaluated. You can see the functions which allow you to do this in the table below:
Function name | What it does |
|---|
COLLAPSE | Evaluates a calculation at a higher level of a visual axis. |
COLLAPSEALL | Evaluates a calculation at the highest level of a visual axis. |
EXPAND | Evaluates a calculation at a lower level of a visual axis. |
EXPANDALL | Evaluates a calculation at the lowest level of a visual axis. |
Read on to understand why this is useful!
If you're familiar with writing DAX measures involving the CALCULATE, ALL and REMOVEFILTERS functions, you'll be familiar with the concepts covered in this part of the blog. These new functions may make your life easier!
Levels in a Visual
In a visual with multiple levels of grouping, it's common to want to compare the value of a detail row with the value of a row at a higher level. The matrix below shows the total run time for a list of films grouped by director and genre. Three visual calculations show the percentage that each film contributes to the total for the genre, the director and the entire matrix:
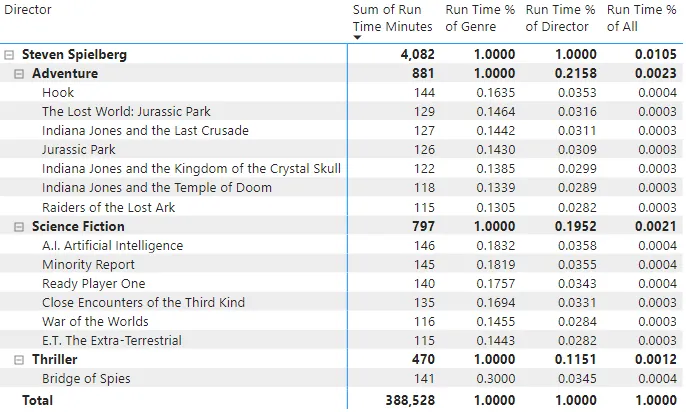
It would be more readable if we could format the visual calculations as percentages!
Each of the visual calculations shown above needs to refer to a value at a higher level of grouping in the visual. You can use the COLLAPSE function to do this.
The COLLAPSE Function
You can use the COLLAPSE function to reach a different level in the hierarchy of groups in a visual. You can use the function with a couple of different syntaxes, as shown in the table below:
Syntax | What it does |
|---|
COLLAPSE( Expression, Column ) | Calculates the expression at the first level on which the specified column doesn't apply a filter. |
COLLAPSE( Expression, Axis, [Number of levels] ) | Calculates the expression the specified number of levels above the current level on the specified axis. |
To understand the table above, it's important to know which fields apply filters to different rows in a visual. The diagram below attempts to explain this:
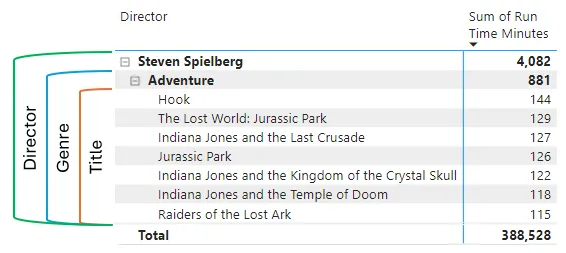
The Title field applies a filter to each individual film. The Genre field applies a filter to each genre and film. The Director field applies a filter to each director, genre and film. The total row is unaffected by any filter.
The formula shown below returns the total run time for the first level in the hierarchy which doesn't have a filter applied by the Title field (moving upwards from the current row):

This formula returns the sum of the Run Time Minutes field, removing any filter applied by the Title column.
You can see the result of this formula in the diagram below:
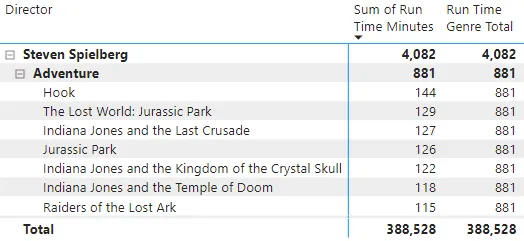
The rows which were being affected by a Title filter no longer are.
The next step is to divide the value for the current row by the unfiltered value, as shown below:
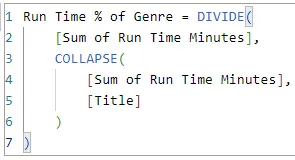
Use the DIVIDE function to safely divide values in DAX.
You can see the result in the diagram below:
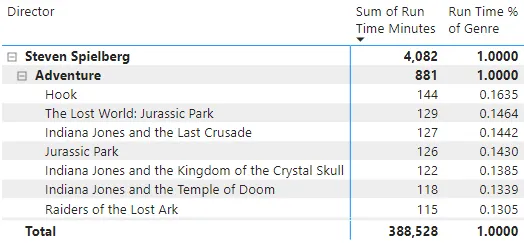
It's a shame that we can't (yet) format the visual calculation as a percentage.
You can use the same technique to return the total run time for the director, as shown below:
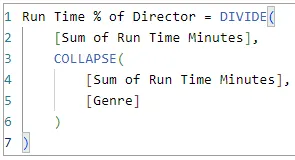
The COLLAPSE function in this example removes the filter from the Genre field. The next level up in the visual's group hierarchy is the Director field so we get the total for the director.
You can see the result below:
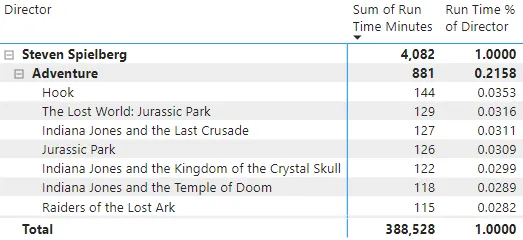
Each film and genre is compared with the total run time of the director.
Hiding Values for Group Headers
Displaying a value for group totals in the above example is a little pointless. You can use a range of standard techniques to hide the group totals; one example is shown below:
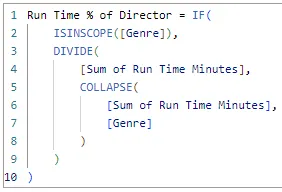
This combination of IF and ISINSCOPE functions checks if the Genre field is applying a filter and only displays a result if it is.
The end result is a cleaner looking visual:
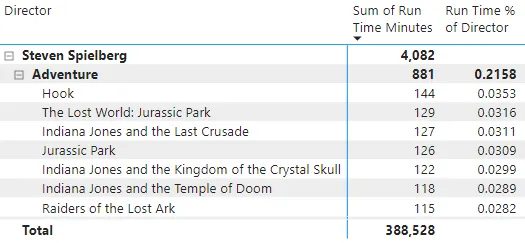
The result of the formula is only displayed on the appropriate rows.
Removing Hierarchy Filters Relatively
Instead of specifying which column to remove a filter from, you can tell the COLLAPSE function to step up to another level in the hierarchy. The example below calculates the total run time for the next highest level in the hierarchy:
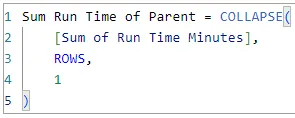
This example moves 1 level up in the ROWS axis and calculates the Sum of Run Time Minutes at that level.
You can see the results in the diagram below:
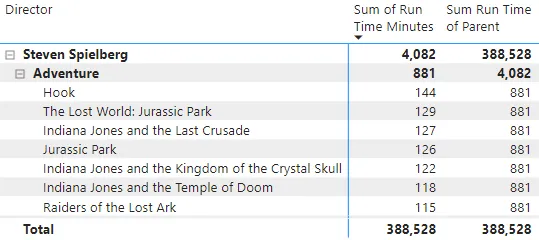
Each film gets the total of the genre. Each genre gets the total of the director. Each director gets the total of the visual.
Removing All Visual Hierarchy Filters
You can use the COLLAPSEALL function to quickly remove all visual hierarchy filters and return the total for the visual:
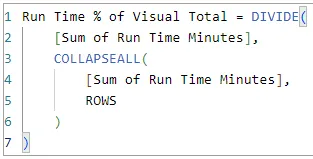
This COLLAPSEALL function removes all filters from the ROWS axis of the visual.
You can see the result of the formula in the diagram below:
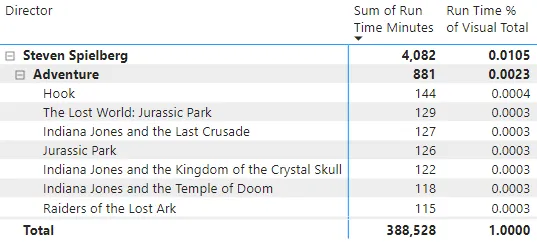
The run time for each film, genre and director is divided by the total run time for the visual.
The EXPAND and EXPANDALL Functions
The EXPAND and EXPANDALL functions move from a higher to a lower level in a visual's hierarchy. You can use these functions to return details of the child items in a group. The syntax of each function is shown in the table below:
Syntax | What it does |
|---|
EXPAND( Expression, Column ) | Calculates the expression at the first level on which the specified column applies a filter. |
EXPAND( Expression, Axis, [Number of levels] ) | Calculates the expression the specified number of levels below the current level on the specified axis. |
EXPANDALL( Expression, Axis ) | Calculates the expression at the lowest level of the specified axis of the visual hierarchy. |
Because the EXPAND and EXPANDALL functions are likely to return multiple values, you'll usually need to use a function to aggregate the expression.
In the matrix below, each group shows the maximum value of the average run time for its immediate children:
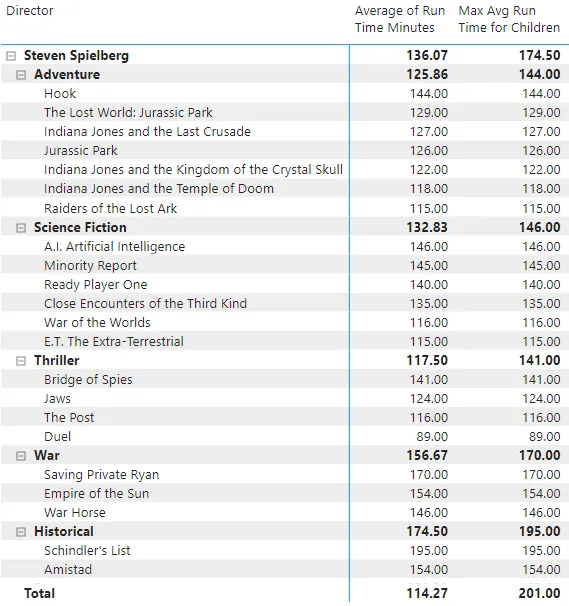
On average, the longest genre of films directed by Steven Spielberg is Historical, with an average run time of 174.50.
You can see the formula used to return this value in the diagram below:
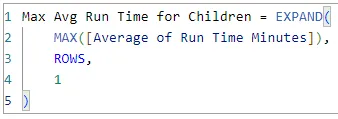
The formula moves one level down in the ROWS axis of the visual hierarchy and returns the maximum value of the Average of Run Time Minutes calculated at that level.
The Verdict
While visual calculations can make a few DAX calculations easier than the equivalent measures, they're probably not going to change your life immediately. In their current state, I suspect that I'll use visual calculations infrequently - they're certainly not a complete replacement for measures yet! From reading Microsoft's articles on the topic it does appear that they're pretty excited by the possibilities that visual calculations offer, so I'd expect to see this feature become more prominent in future releases of Power BI Desktop.


