Read our blogs, tips and tutorials
Try our exercises or test your skills
Watch our tutorial videos or shorts
Take a self-paced course
Read our recent newsletters
License our courseware
Book expert consultancy
Buy our publications
Get help in using our site
547 attributed reviews in the last 3 years
Refreshingly small course sizes
Outstandingly good courseware
Whizzy online classrooms
Wise Owl trainers only (no freelancers)
Almost no cancellations
We have genuine integrity
We invoice after training
Review 30+ years of Wise Owl
View our top 100 clients
Search our website
We also send out useful tips in a monthly email newsletter ...
Changes introduced in the Power BI Desktop May 2023 update Part four of a five-part series of blogs |
---|
The big event this month is the (long-awaited) release of Azure Maps, but the May 2023 update also includes the official launch of the Optimize ribbon and allows you to use measures as data labels, among other changes.
We've been creating our idiosyncratic monthly blogs on Power BI updates since November 2016, and also deliver online and classroom Power BI courses. |
In this blog
It's not often that Power BI Desktop gets a completely new ribbon!
The new Optimize ribbon should (if used judiciously) let you speed up report development.
The ribbon addresses 4 separate issues, which I'll explain under separate headings below.
These leftmost two buttons do pretty much what you'd expect:
Here I've chosen to pause my visuals.
The idea is that you can concentrate on developing your reports, without having to worry about waiting for visuals' underlying queries to run:
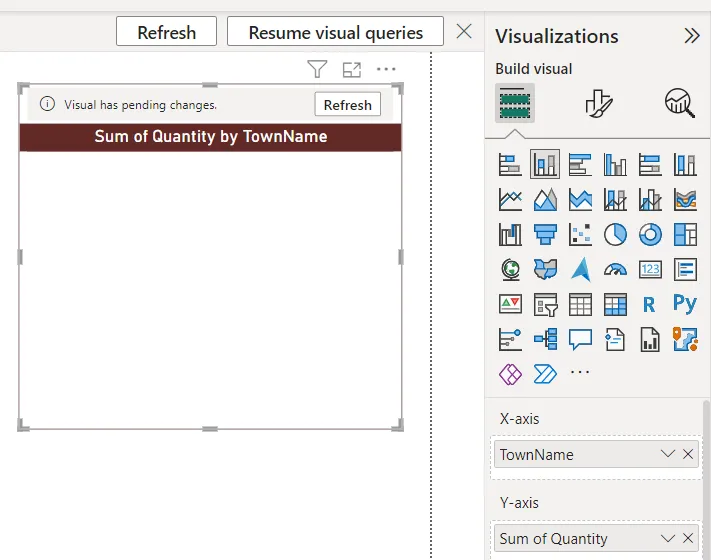
Here I've created a column chart showing total quantity sold by town name, but it's not displaying any data because I've paused my visuals.
You can either click on the Refresh button for the visual to update the data just for this one visual, the Refresh button as shown in the ribbon to update all of your visuals or the Resume visual queries button to stop pausing visuals altogether.
This would be a good idea, but surely a better alternative is to use Query Editor to pick out just the top 10 rows from any query while building reports, then remove this constraint just before you publish them? You'll then be able to see the effect of changes that you make to visuals as you make them.
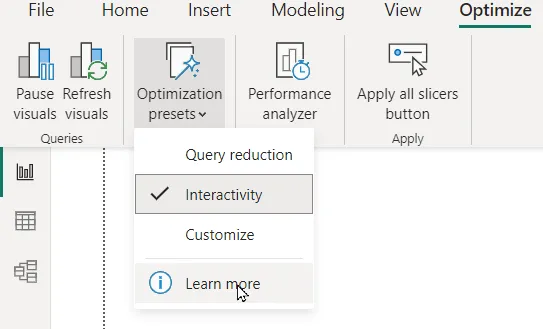
This allows you to choose between 3 different pre-sets:
You can click on the link shown to learn more - it will take you to this page.
Here's what the different options mean:
Pre-set | What it does |
---|---|
Query reduction | Turns off cross-filtering and adds an Apply button to the filter pane. |
Interactivity | The default mode, allowing all real-time changes to slicers and filters. |
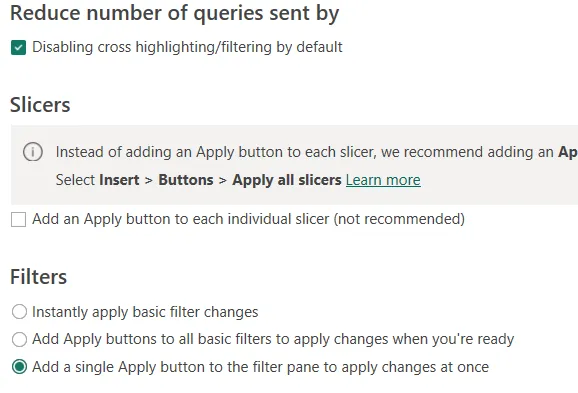
Customize | Opens the Query reduction tab of the Power BI Desktop options dialog box, as shown below. |
Here's what you see if you choose to customise your settings:
These options have been there for a while - they're just easier to get at now.
Full disclosure: on my Power BI Desktop choosing Query reduction chose the relevant options in the Query reduction settings, but didn't actually seem to make any difference! I think this may be down to my lack of understanding of (and interest in?) this feature.
The performance analyzer tool allows you to record how long it takes different visuals to refresh, so that you can identify any bottlenecks in your system: it's been in Power BI for some time.
This just provides an alternative way to add a button to apply all of the slicers in your report, a feature introduced last month.
So although this is a new ribbon, it really only contains one genuinely new feature: the ability to pause and refresh visuals to speed up report development. The tools on the Optimize ribbon will be most useful to those using DirectQuery or very large datasets.
Parts of this blog |
---|
|
Some other pages relevant to the above blogs include:
Kingsmoor House
Railway Street
GLOSSOP
SK13 2AA
Landmark Offices
99 Bishopsgate
LONDON
EC2M 3XD
Holiday Inn
25 Aytoun Street
MANCHESTER
M1 3AE
© Wise Owl Business Solutions Ltd 2024. All Rights Reserved.